


Product analytics for B2B companies is very different from B2C ones.
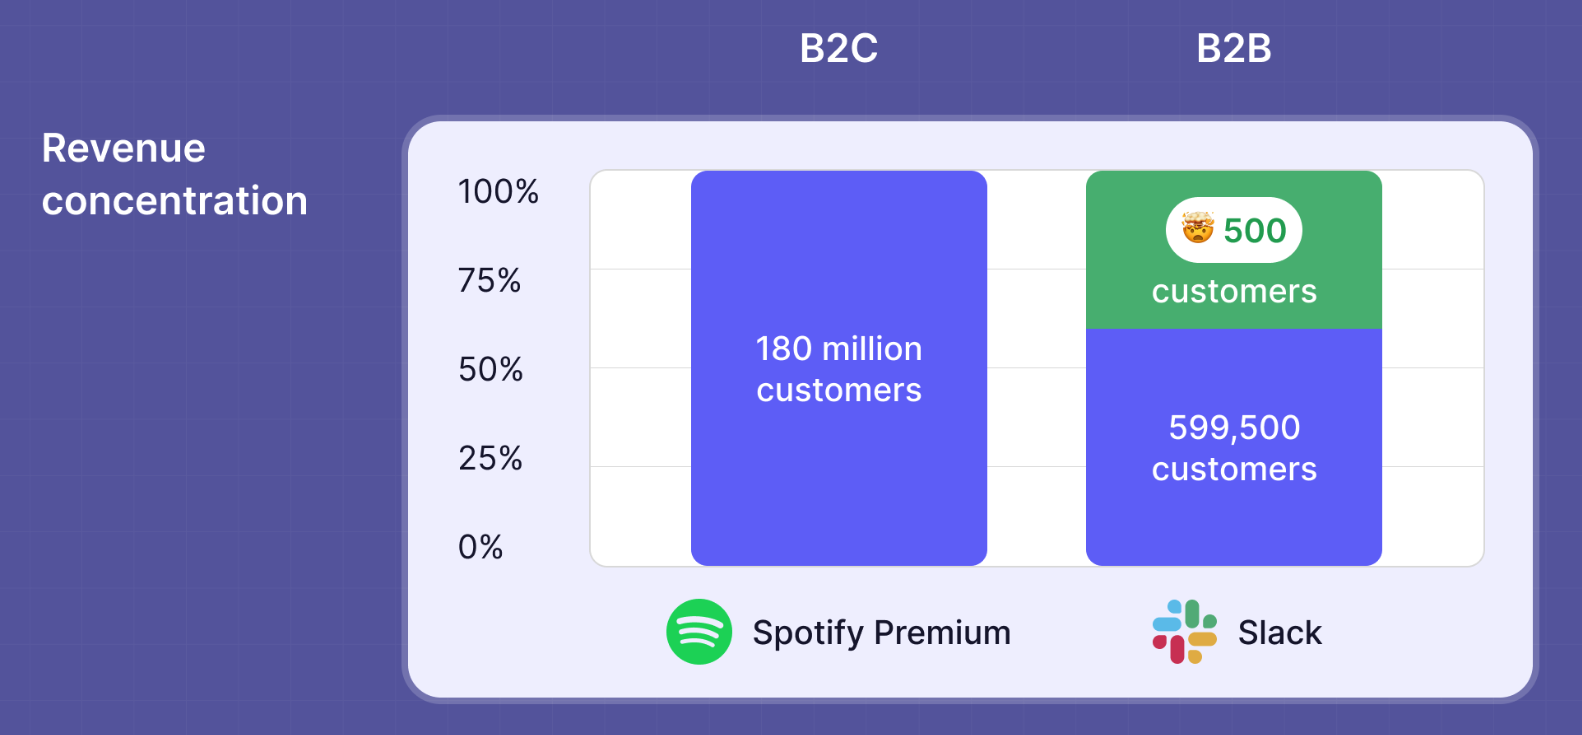
B2C companies make very little $ from a lot of people. Enterprise B2B companies make a lot of $$$$$ from very few clients.
The way these two types of companies use product usage data must be very different right?
Yes and no.
Some parts are similar but some are very different and after 3 years of talking to customers I’m pretty comfortable saying that not many people know what are the peculiarities of great B2B tracking.
So, if you’re B2B and your ACV is reasonably high (>$2-3K year) keep on reading.
From high-level aggregated metrics to zoomed in ones
We’re used to calculate metrics across a vast number of users / accounts or at most by targeting our analysis to some specific cohorts.
This is because human brains are used to thinking in terms of averages or medians.
John: “What’s your W12 retention?”, Pam: “Mhh, around 25%”
This is normal because product analytics is mostly used to steer (actually back in most cases) long term decisions on wide themes such as: activation, discovery, conversion etc.
Intuitively, aggregated metrics are important especially when you’re in a volume game.
To improve its retention by 5% (which would result in 9M saved clients), Spotify needs to run complex A / B testing and optimize every single flow based on the usage of millions of users.
To get to a similar milestone, Slack needs to focus its energies on renewing just 25 new big deals which is clearly a different game compared.
With this I’m not saying that if you’re in the B2B game you should not use high level metrics to measure your business, but that you should not use only those.
You should be playing a one-on-one game. And use data to win.
The one-on-one game: single customer dashboard
When an account is worth big bucks, special treatment and care are needed. For this reason, you should make sure that you have great observability and insights on each one of your clients.
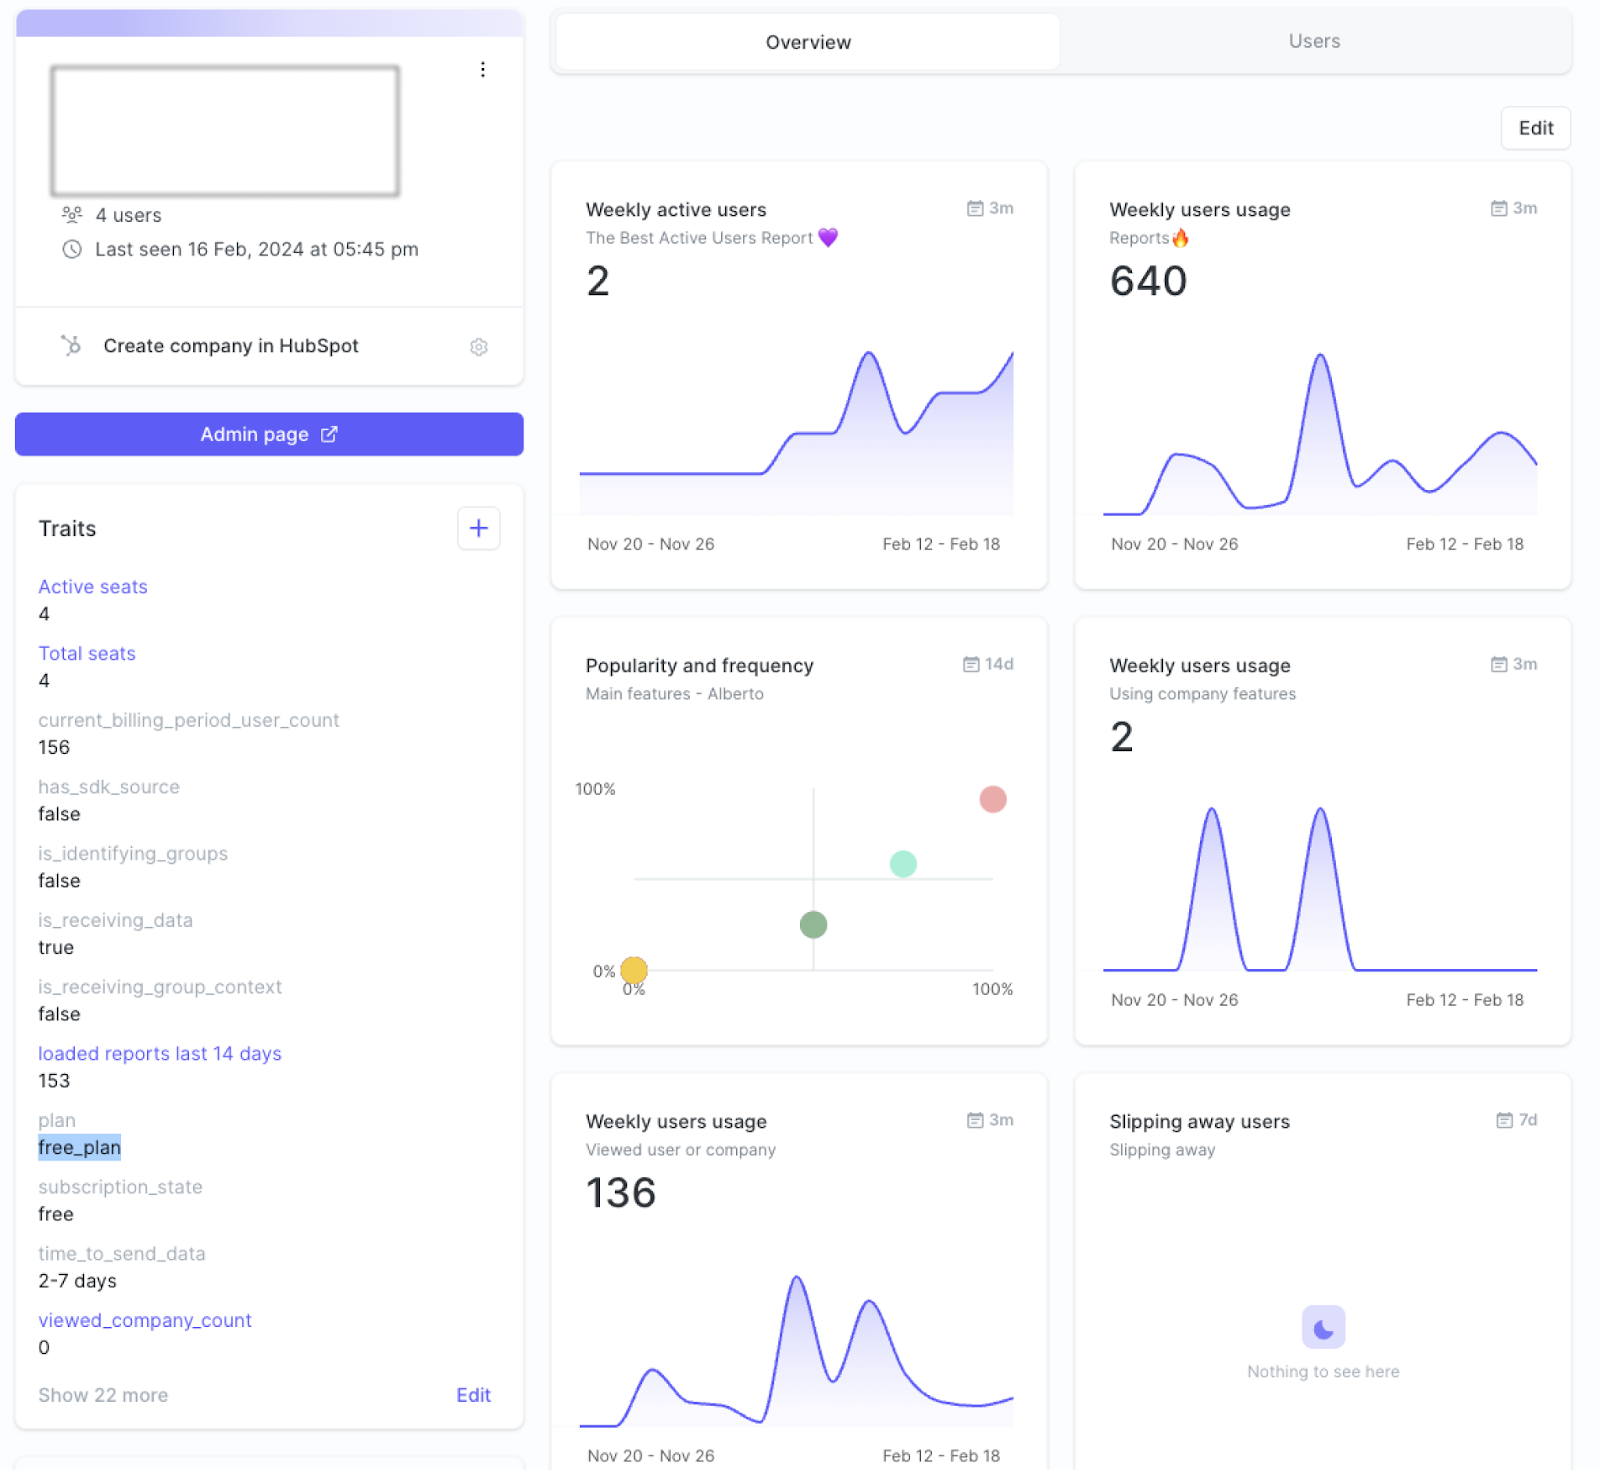
The most important things to know usually are:
- Active seats
- Total seats
- Most engaged users
- Unengaged users
- Core feature usage
These data-points should give you all the elements you need to monitor, one by one, all of your most important clients.
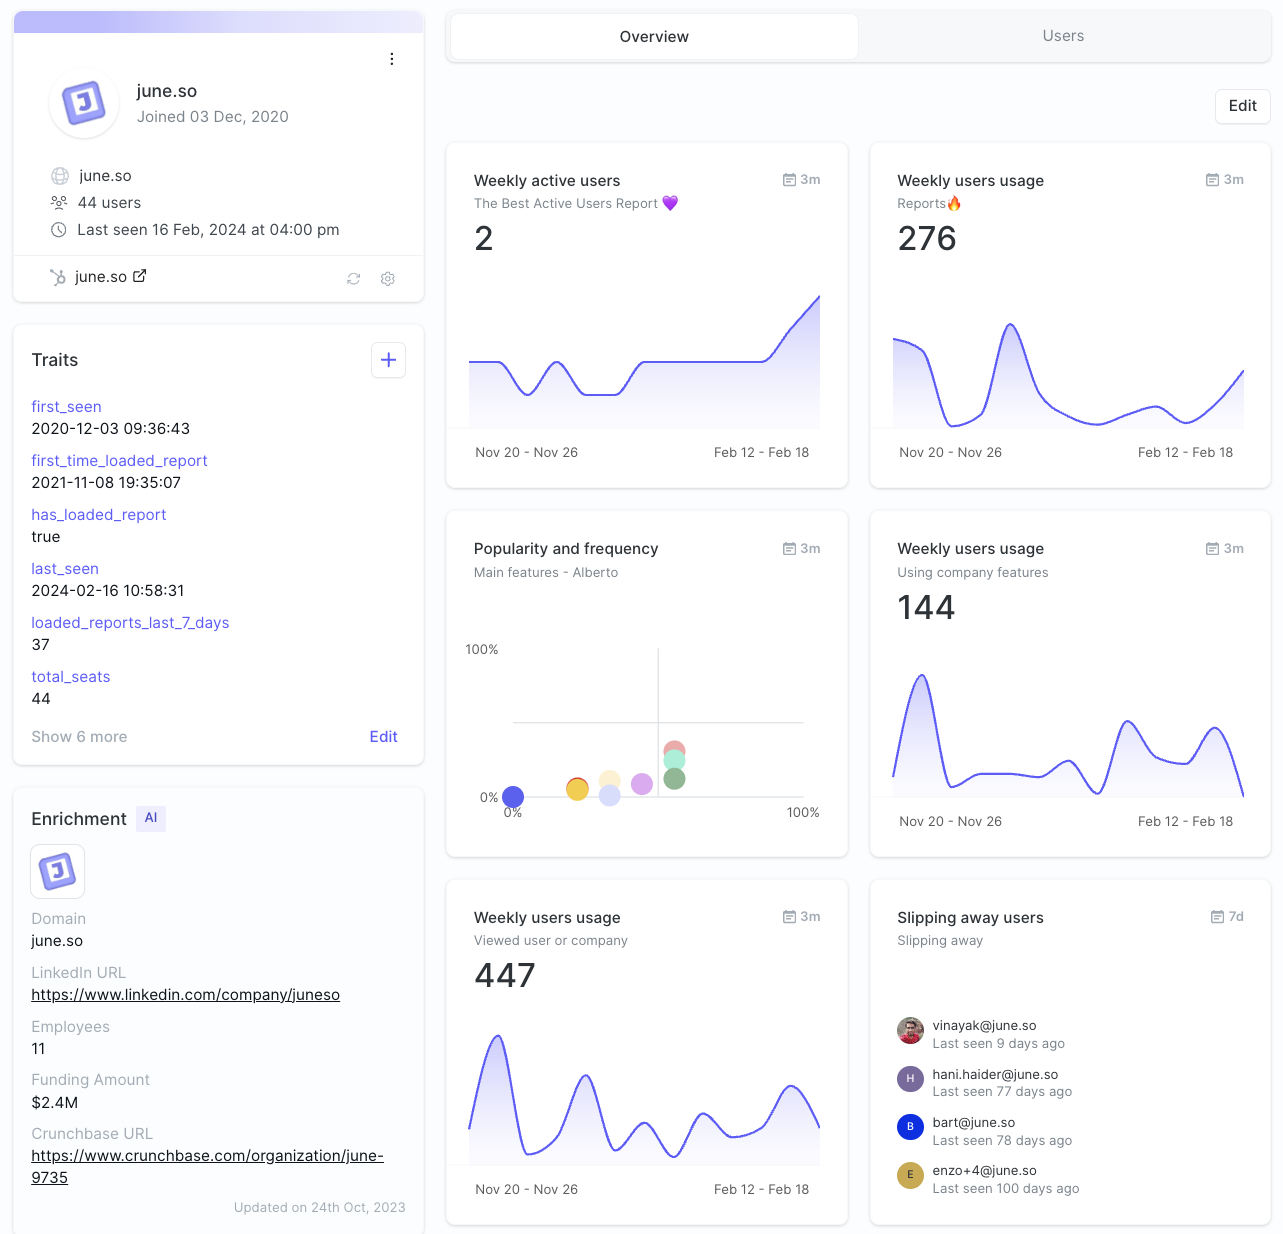
In the example above you can see what are the things that we track for our own customers.
This dashboard (on in June’s language Company page), allows us to understand at a glance whether a customer has a healthy or unhealthy usage. It’s super easy to understand if help is needed to put them back on the right track and avoid churn.
If you’re curious about how to best set up your own company page in June check out this video.
Using the company page in practice
In theory, theory and practice are the same. In practice, they are not.
So how do actual humans use this in their daily work?
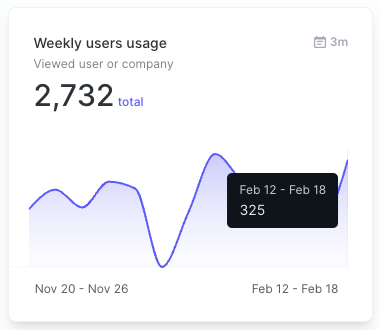
- Before jumping on a call: every time I have a call with a customer, whether it’s a sales call or just a support one, I always check their company page. And a LOT of our customers do the same. Check out below how many company pages this seed stage B2B customer of ours is opening every week !
- To re-engage churning customers: people set up saved audiences (cohorts) to identify companies that are at risk of churn and then go through the list by clicking into each company. Then, from the company page they find out on which elements to anchor for an effective message. In this case for example they could send a guide about the benefits of the Slack integration
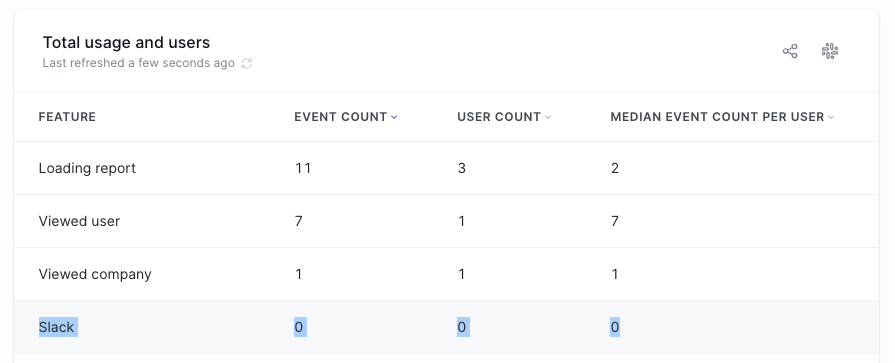
- Convert product qualified companies: starting again from an audience, sales reps use the company page to understand whether it’s the right timing to try to upsell or cross-sell some features to a certain client. In this example we can see that the company is on a free plan and the usage is trending up!
Conclusion
Product usage data has often been a tool for guiding product decisions.
Yet, for B2B companies emphasizing data-driven strategies, this data becomes vital not just for product development but for directly tackling challenges like reducing churn and enhancing customer retention.
If you're navigating B2B tracking complexities and need insights on optimizing your strategy, reach out to me at alberto@june.so


