


Churn is your #1 enemy. It slows down your revenue growth, scares investors and demotivates your team.
Early-stage startups selling to the bottom and mid-market companies often have >3% of monthly revenue churn.
Still, most teams are only reactive to churn. The key though, is being proactive.
In simple words: understand when the account is starting to take a bad trajectory, reach out and help them get back on the right path before it is too late.
But what’s a bad trajectory?!?!
Understanding churning usage
I’ll be honest: this process is still a bit manual but (hopefully) you don’t have too many churned customers to analyze 😁
Here’s what you’ll need to do:
- Identify churned customers
- Understand who they are and how they behaved before churning
- Come up with some “churn predictors” and a way to measure them
- Using churn predictors proactively in the CRM
Identify the churned customers
First of all, you'll need to flag all your churned accounts. In June, you can add properties (traits) programmatically using the .identify or .group call or manually
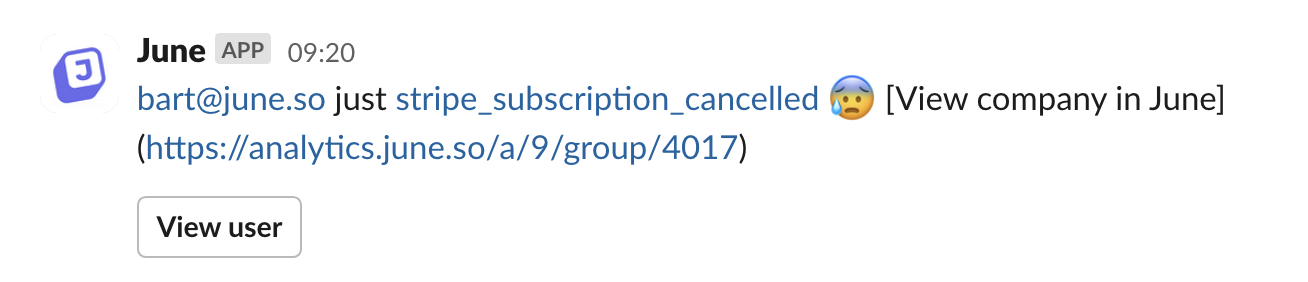
The way we do this at June is through Stripe. Whenever a customer cancels a subscription, we trigger an event (for which we have a notification in Slack) and a group call to update the subscription state of the company.
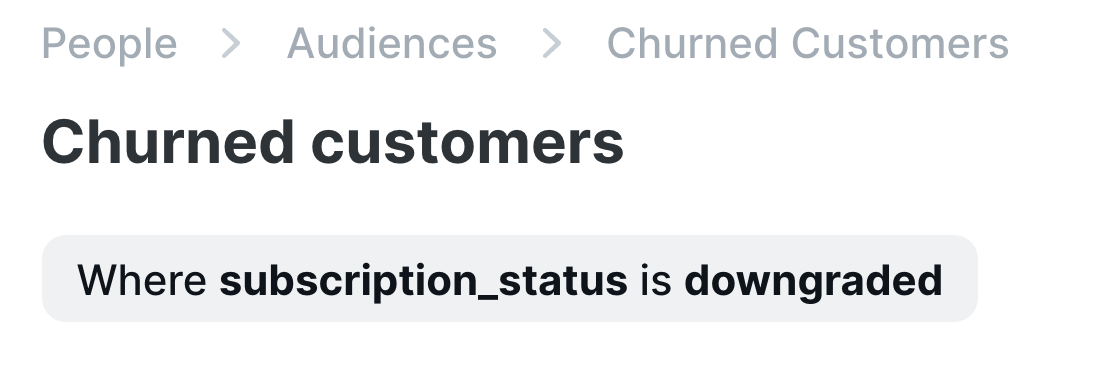
With the right trait in place, you’ll be able to have an Audience with all of your churned customers in June and use it both as a list and in reports (you can benchmark other cohorts with this one!)
Understand who they are and how they behaved before churning
There are various ways in which you can do this but here’s how we do it for ourselves.
First of all you’ll need a way to understand which features you customers used the most and which instead were not even used. The best way to do this is by using our Feature Audit report.
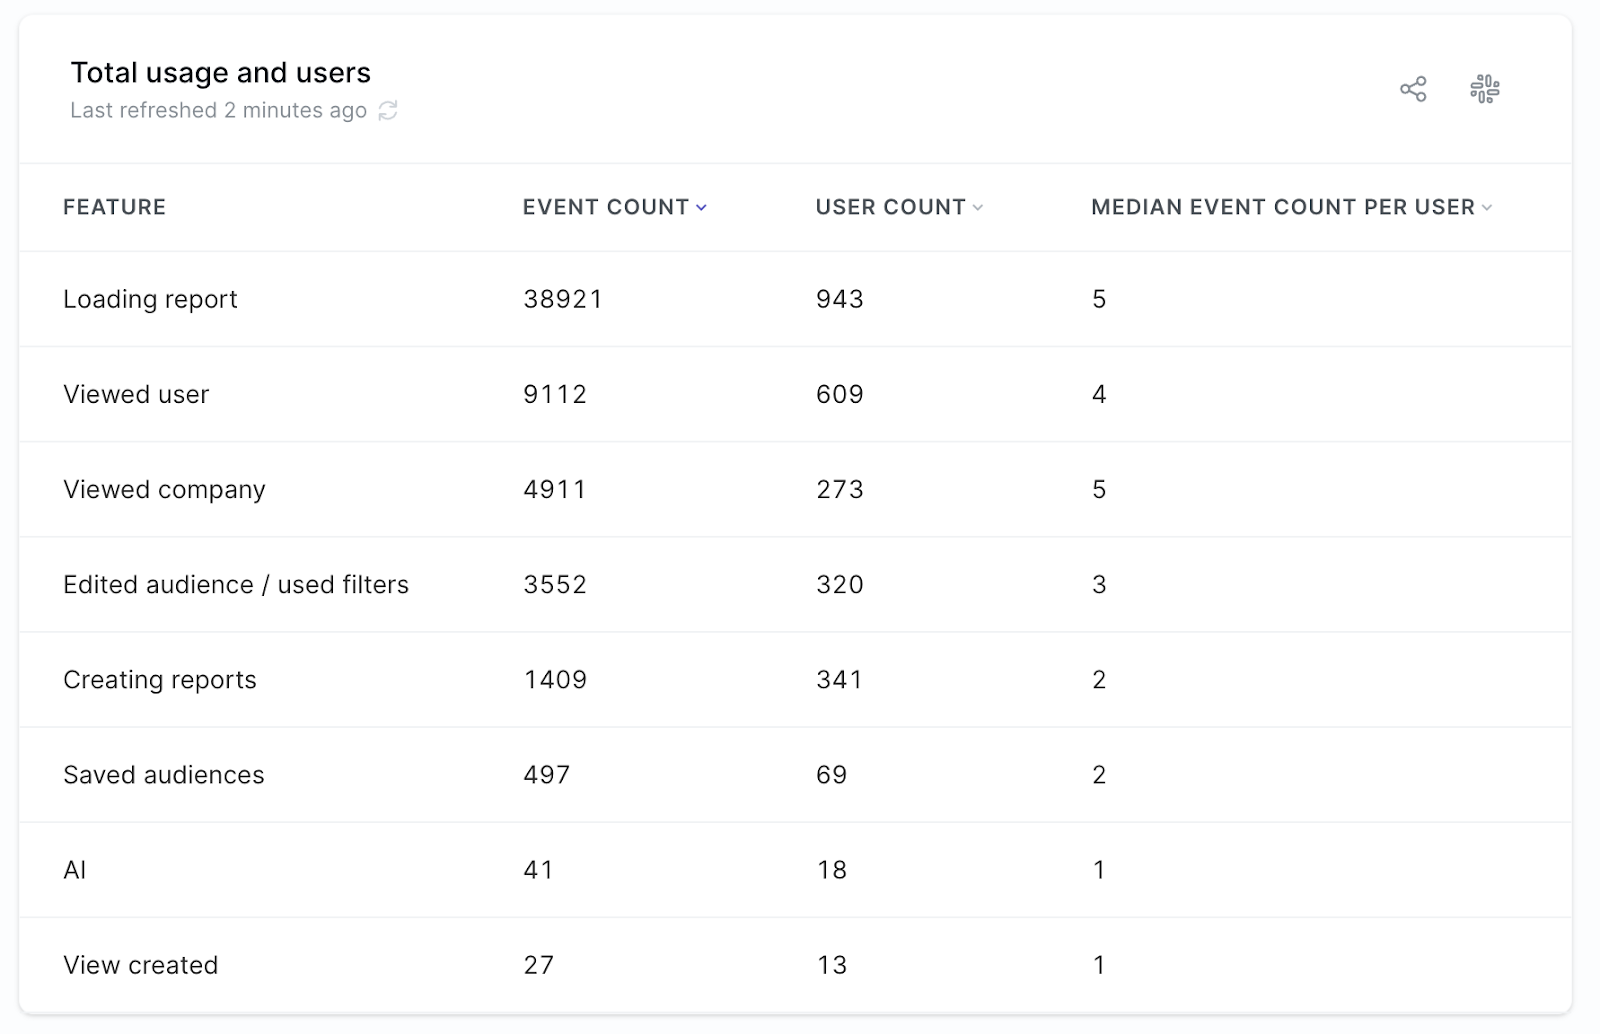
This report will need to have all of your core features so that you can see how many people used them and with which frequency.
By customizing the audience, you should already be able to see which parts of your product are the most critical ones and which instead are not really related to a churning behavior.
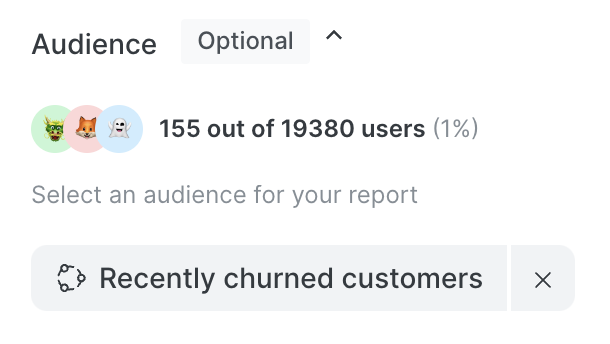
Still, here we’re looking at aggregated behavior which, even if informative, is not as insightful to determine what the churn predictors are.We need to go more in depth.
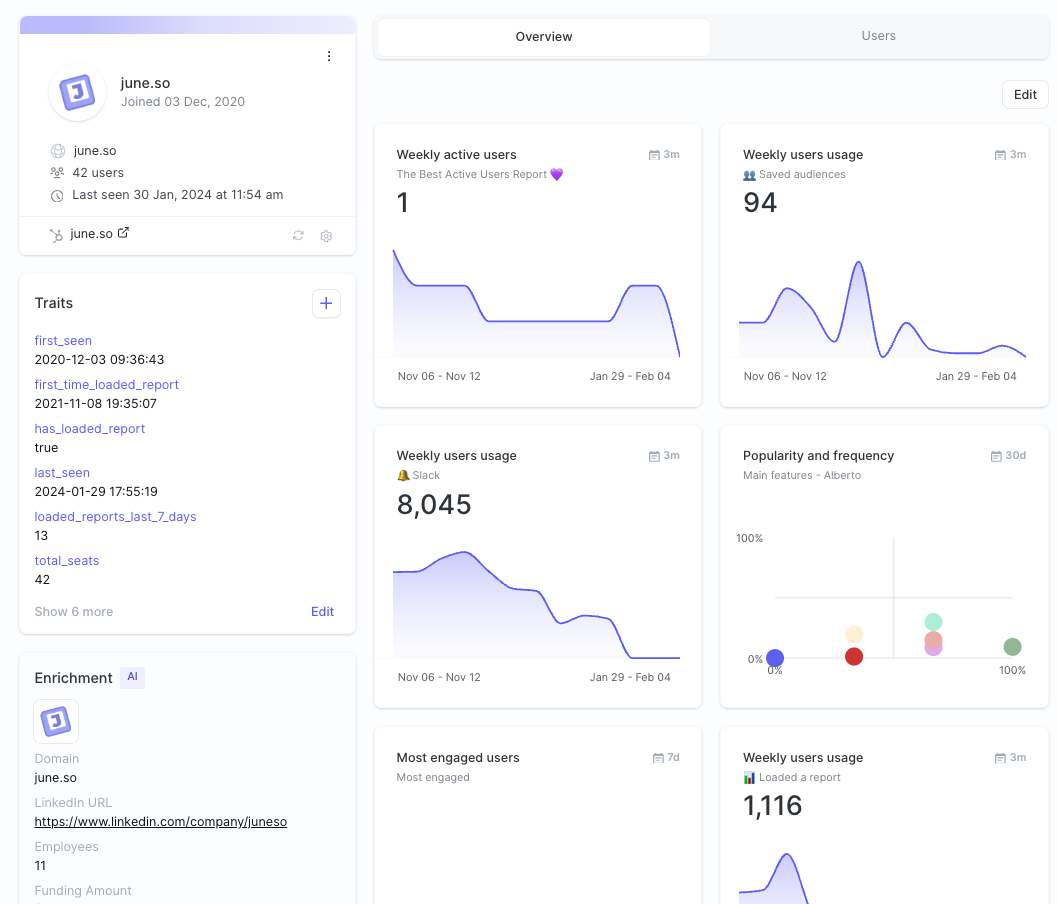
By adding the same feature audit to workspace / company profiles you can now dig deeper into how each single churned company interacted with your app in the days before churn.
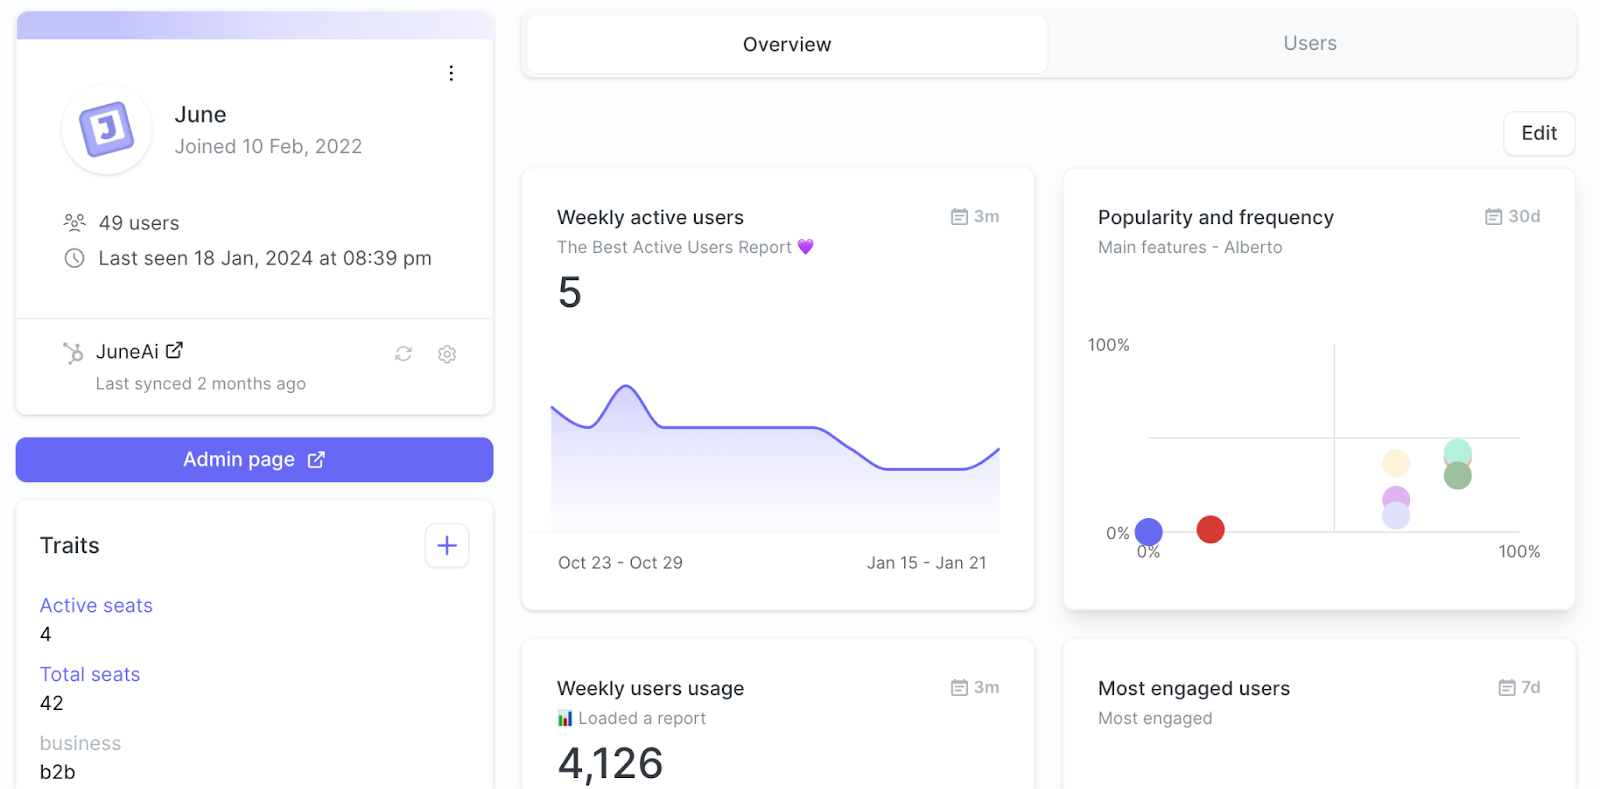
After going through a couple of them you’ll be able, with just a glance, to identify a company which is on a bad trajectory.
By now, you should have a good understanding of what a bad journey looks like!
Come up with some “churn predictors” and a way to measure them
Here comes the manual work 😛
Now we know how people behaved before churning but we’re missing one last piece of the puzzle.
- Who are they?
- Are they within our ICP or just a random company that we don’t really care about?
- On which plan were they?
- How long did they stay before churning?
Personally, I like to fill a spreadsheet with all the useful information together. This makes it easier to find patterns and identify trends at a glance.
Here’s a small piece of our sheet with a couple of interesting data points from which we can derive patterns
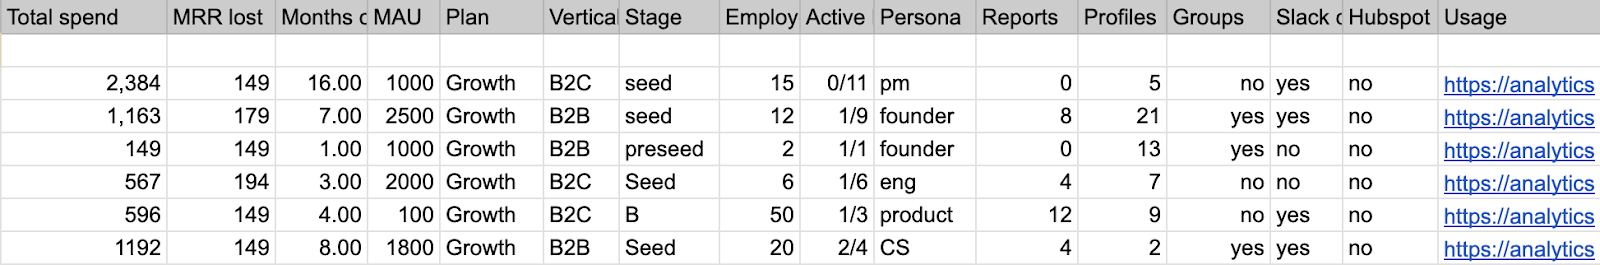
Interesting patterns:
- most companies had only 1 active seat in the previous 14 days → good churn predictor
- all companies opened less than 15 reports → good churn predictor
- All companies opened less than 20 profiles in the previous 14 days → good churn predictor
Here’s the sheet with the data points I personally use.
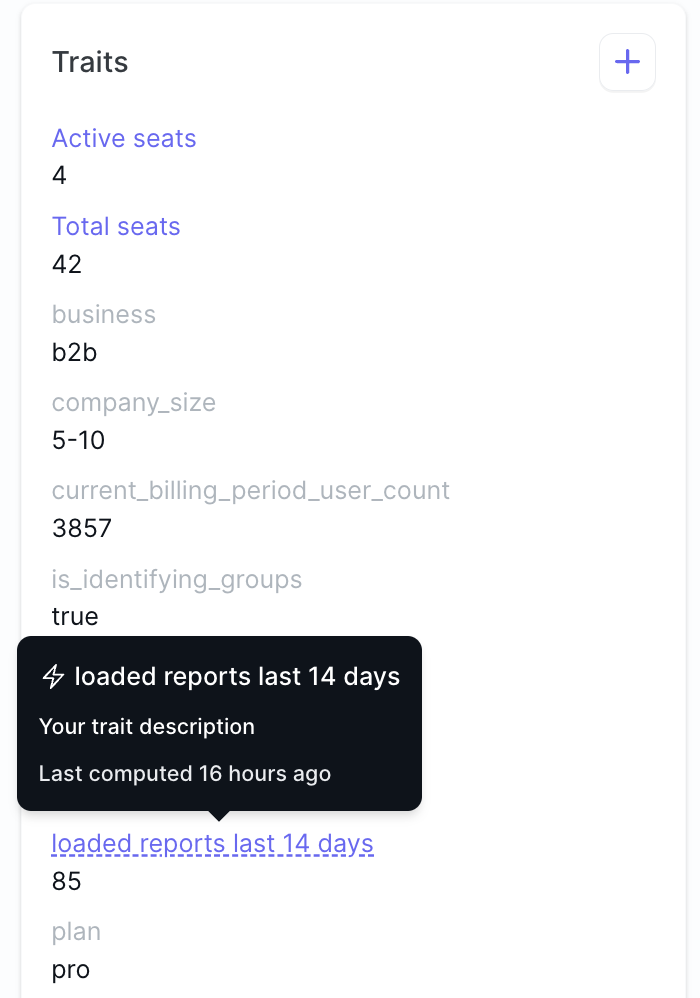
Now that we know under which numbers we should worry, we need to measure them at scale.To do this, we will use Computed traits. This feature will compute every day these predictors for all of your companies.
Using churn predictors in the CRM
It’s action time!
Once you have all of your churn predictors in June, sending them to HubSpot or Attio is a piece of cake!
In this video you can see how to set up the integration in just a few minutes!
Once you have all your churn predictors in the CRM, you can use them to set up workflows or lists so that you can re-engage customers before it’s too late.
Here you can find some examples of reactivation efforts we run on an ongoing basis at June.
Example 1
Here’s an Attio list that we use to reach out to accounts with only one active seat (very dangerous scenario for us!)
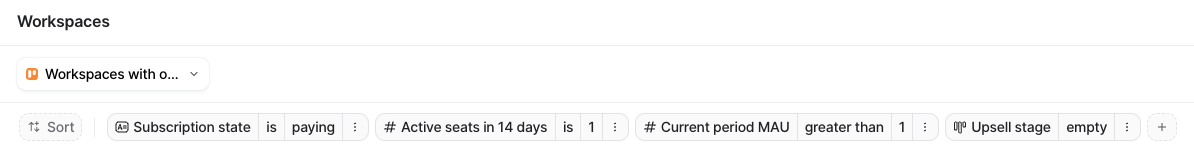
The rationale behind this initiative is the following:
Vast majority of the companies that churn from June have only 1 active (or not so active) member. In most cases they invite most of the team but they do not really activate. Normally the most active person is the founder which also happens to be the only “persona” that cares about others in the org. For this reason reaching out to him offering to help the team activate in June and make them more successful would be a good bet.
Process:
- Go find the workspace in June using the Id.
- Find who’s the active seat there (using active users report or another one there on the company page).
- Make sure you did not email them with the other sequence recently
And this is the copy we use
Subject: What about <teammate1>, <teammate2>, and <teammate3>?
Hello,
it's Hani, customer success at June
I noticed you've been the main person at <company name> using our app, and it got me thinking. Our dream for June has always been to make it super user-friendly for everyone in a team, whether they're in engineering, sales, or anywhere in between. The goal is to make sure everyone knows what’s happening in the product so that they can do their job at best!
I'm really keen to find out how we can make June work better for you and your colleagues. Maybe there's something we're missing, or perhaps there's a way we can tweak some features to suit different needs in your team?
Looking forward to catching up!
Cheers,
Hani
Example 2
In this Attio list, we focus on pushing some unengaged customers to use a feature that similar customers (based on setup and vertical) like a lot.Rationale: a good amount of customers are tracking groups with their setup but are not using one of our customer’s favorite features: the company page. With this message we will push them to something that technically should be valuable for them.
Process:
1.Go find the workspace in June using the Id.
2.Take a screenshot of their company page (so they can understand what we see about them)
3.Paste it in the email
This is the copy we use
Subject: B2B’s favorite feature
Hi [Company name] team,
Hani here, customer success at June.
I’m reaching out because I noticed that even if you are indeed tracking companies you haven’t really used the “company page” which is one of our b2b customers' favorite features.As an example, you can see here below how you look like in our own June account:[screenshot here of the company page which is object of the email]
As you can see it’s really simple to understand what the engagement of a single company looks like. You can configure your company page how you like it the most to answer questions like: how many weekly active users out of the total seats, which main features they’re using, who are the power users, etc.Most of our customers are using the company page just before hopping on a customer call or just to understand if it’s time to upsell/re-engage.If you have any questions or doubts about how to set it up at best just let us know!!
Best,
Hani
Conclusion
Product usage data has been historically used mostly to back product decisions.
However, if you're a startup with a PLG motion and few resources you need to use your customer's data for more concrete matters such as for reducing revenue churn.
If you have any questions or need help in leveraging your product usage data reach out to me at alberto@june.so


