


Hive is an e-commerce operations platform that handles the entire post-purchase process for D2C companies. From shipping fulfillment to shipment tracking, the platform offers everything in one place. This includes providing packaging, finding the best delivery partners, and monitoring all sales channels. Hive has also built their own Warehouse Management System (WMS), with which they operate their Fulfillment Centers. In addition to the Hive App and WMS, they have their own End-Customer App with which end-customers can manage the delivery and return of their orders.
Lukas Klinser, VP of product at Hive, has been using June to track their product features’ performance on all three of their apps.
Background
Last year Hive announced a $34M investment and has now grown to over 250 employees. Hive is growing fast and constantly working on improving and building on their product offering. Becoming more data centric became one of their top priorities to track adoption and usage of newly launched features. They have found this the best way to gain insights and reflect on what we have shipped. In addition, it enables Hive to find the right mix of users to talk to for feedback.
Challenge
Lukas has taken on the challenge of setting up and organizing analytics with June. Having easy access and understanding of data is key for product teams to use in further iterations and to conduct user research. In Luka's opinion this is not only relevant for the respective Product teams, but across the entire company.
Solution
Deep dive into Features
Hive handles the end-to-end logistics journey for D2C companies by integrating with their shops and marketplaces, booking freight, picking and packing orders, accelerating delivery, and handling returns. Yeah, it’s a lot, all the more reason to stay on top of what we’re building, he says.
Include other workstreams
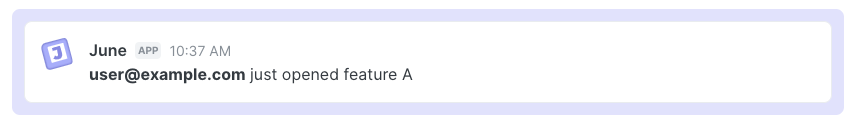
Whenever a feature is released that involves a different workstream, June’s slack integration is leveraged. For instance, when our customers trigger an event requesting more information. These types of notifications keep everyone involved and since they are celebrated, it keeps everyone motivated too.
Identify bottlenecks
Lukas’s most frequently used report type is the funnel. The drop-off rates give a good indication of feature adoption. This can be used in combination with heatmaps for example, to help understand customers’ behavior.

Big drop-offs are easily identifiable and are a great trigger for additional user research. But besides low adoption, June shows users who haven’t used the feature at all as well as users who use it a lot. All meaningful users for getting feedback.
Zoom into features
To get these insights, the Hive team often uses a feature focused report in June called Feature Release.
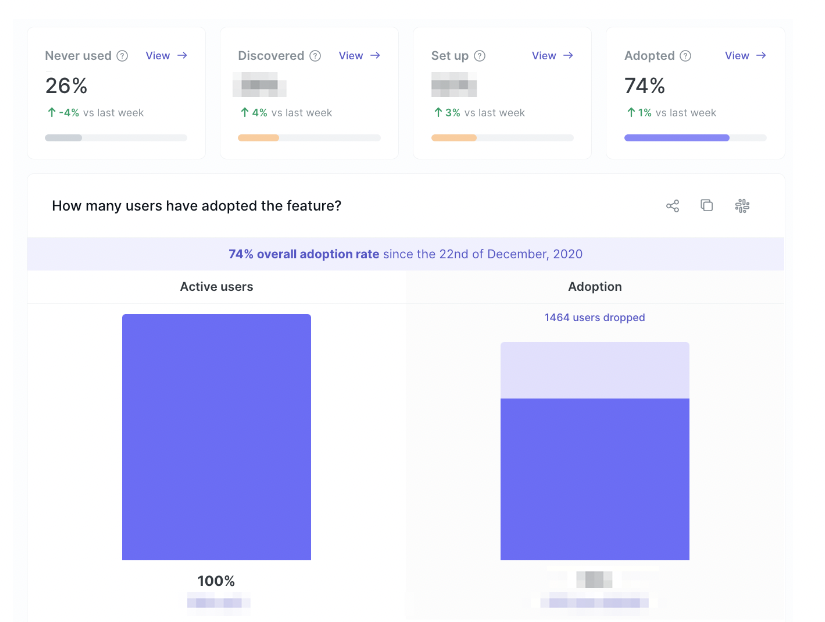
These data points give an overview of the performance of the feature since it was launched whereas the following part of the report provides a list of the most engaged users with that feature alongside with the least engaged ones.

This information is helpful for the team as it’s used as a starting point to schedule customer interviews and design QAs.
After an iteration is deployed or a new feature is released, Lukas creates a Feature Release report to monitor how users are interacting and engaging with the latest updates. It only takes a few minutes, and can easily be shared internally, he says.
Product’s health check
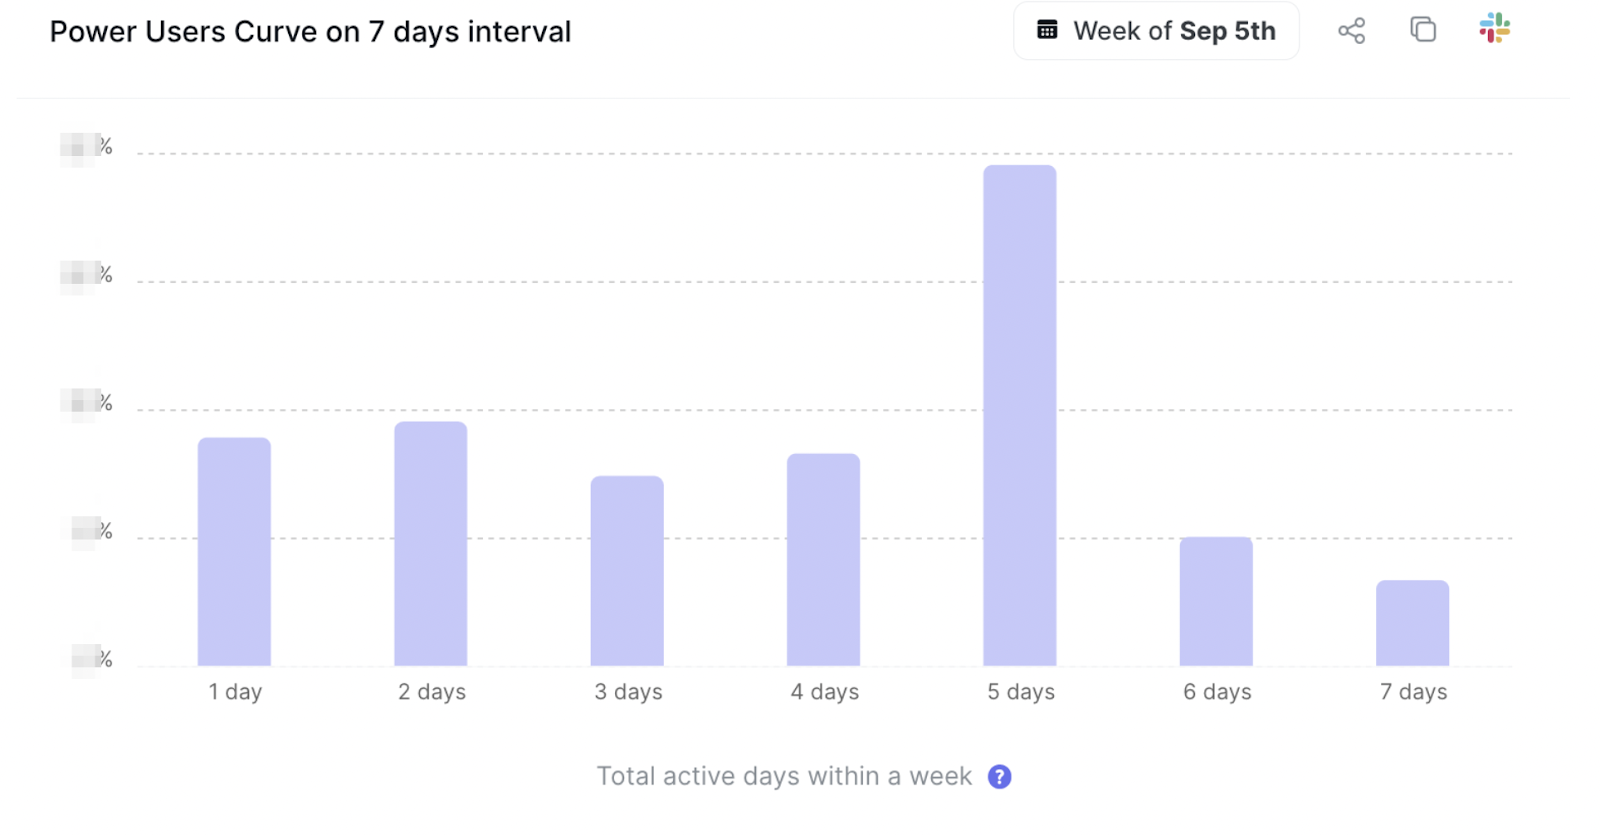
Hive is used by ecommerce companies varying in size and industry. In order to see which users are in the Hive App on a daily basis, the team uses a Power user report.
This report indicates to them the distribution of the active users based on the number of days of activity in a given week. It gives a good indication of busier days for their merchants and better days for communication.
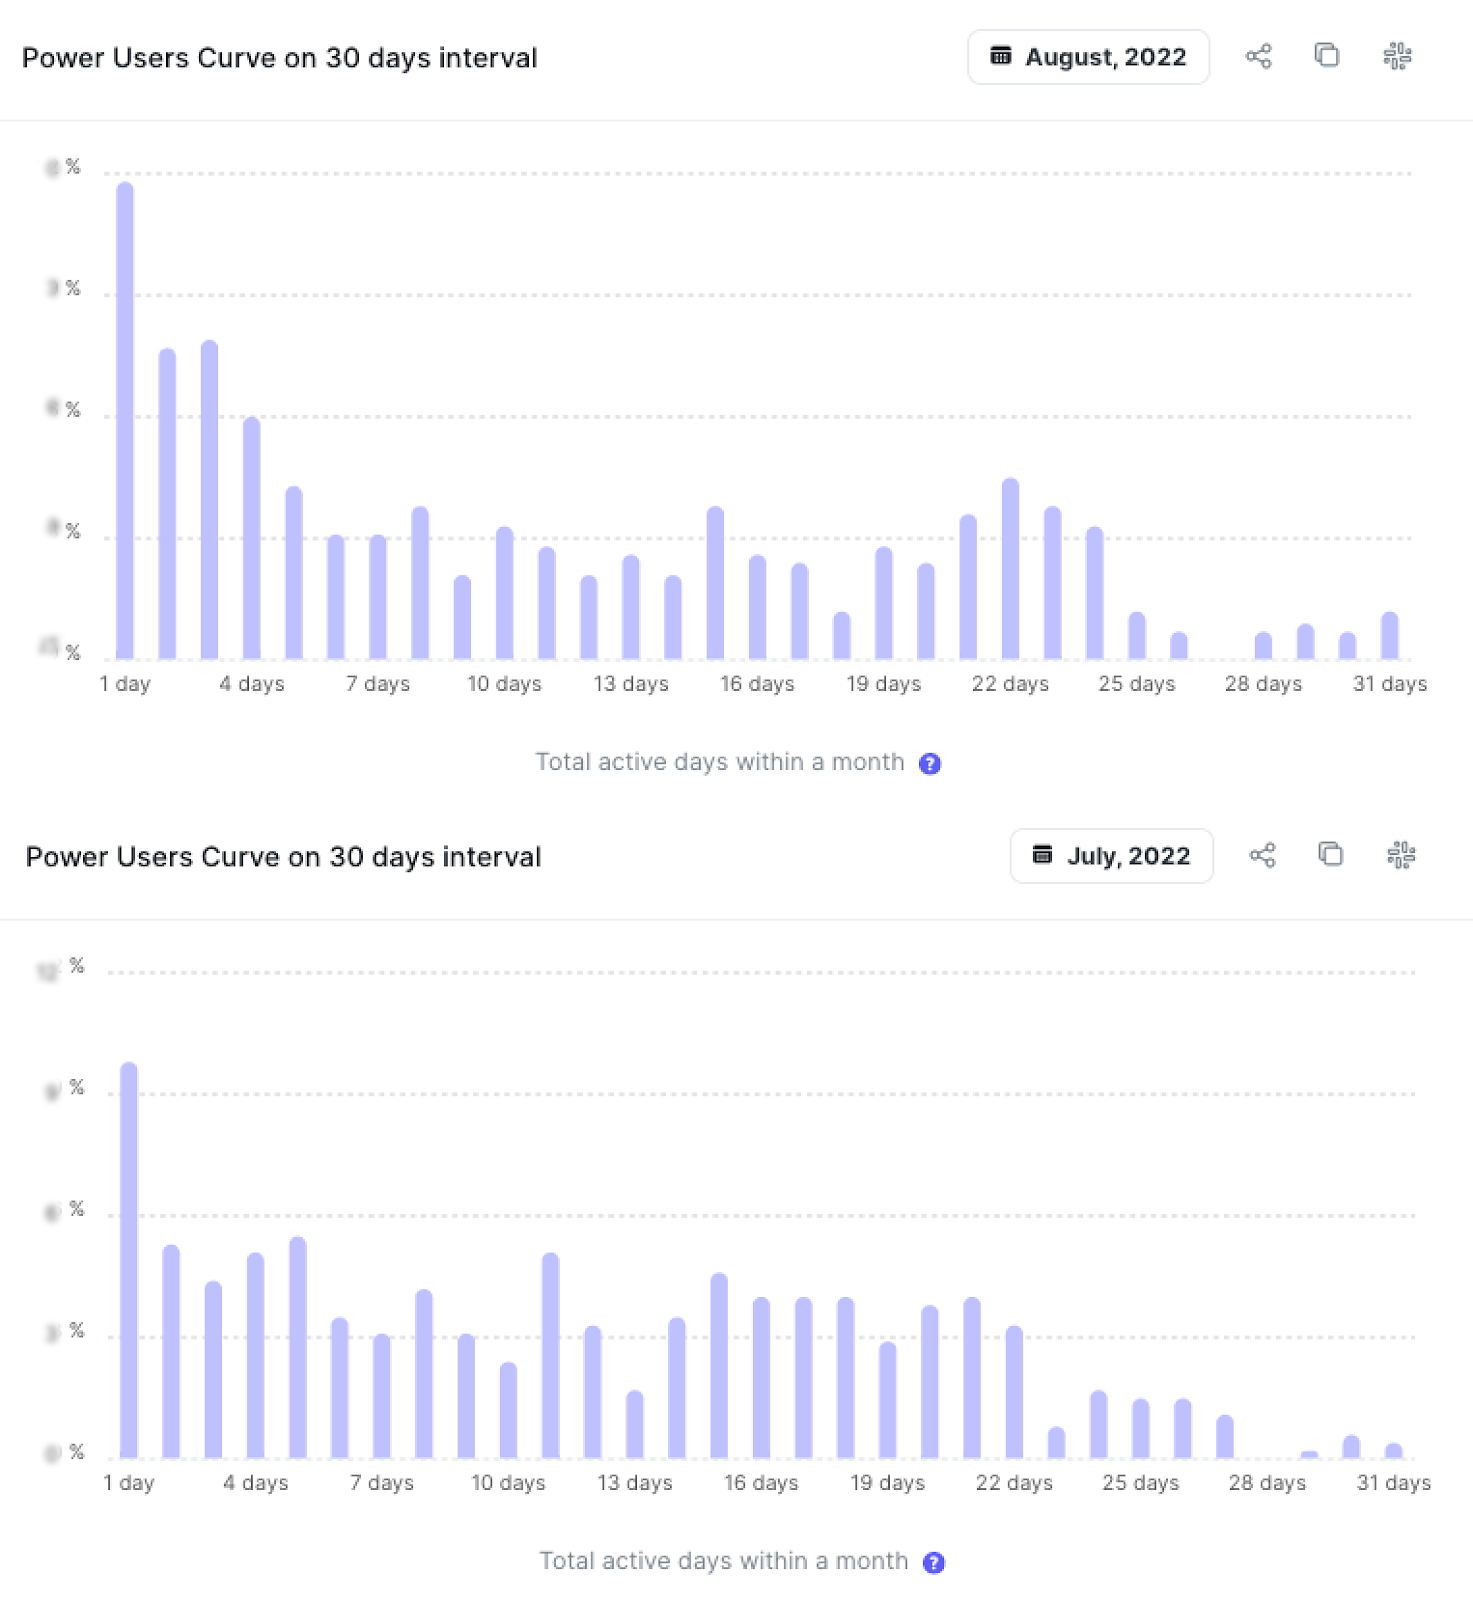
Similarly, every month the 30-day Power User graph is revised to see whether users are engaging more or less with their apps compared to the previous month. For instance, the graphs showed Hive that engagement in August was higher than engagement in July.
Organize reports
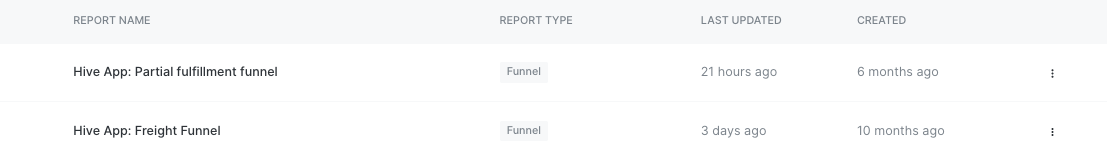
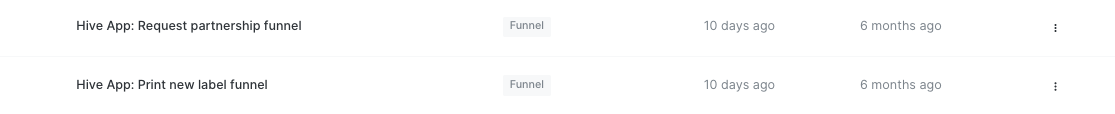
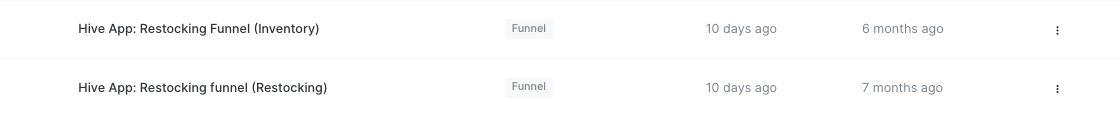
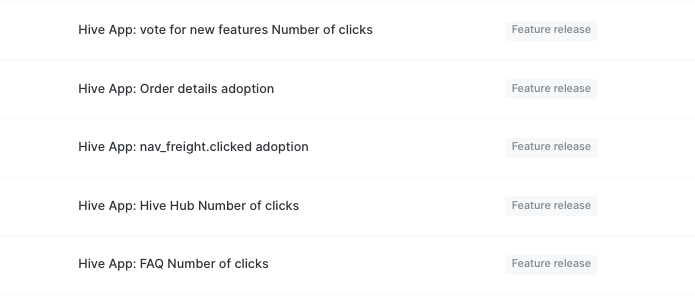
In order to keep reports sorted, Lukas organized all the reports using a naming convention. In combination with the sort function, it helps finding the right reports without getting lost.
This is extremely important for the team. Hive has three apps, meaning we can create over 100 reports. This can be difficult to navigate and retrieving the right information quickly is crucial.
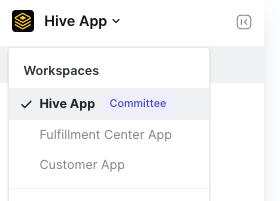
In addition, Lukas created three workspaces, one for each app.
Reports are named in a comprehensible way so that everyone in the June workspace (more than 20 members!) can easily understand what’s inside.
Outcome
Hive uses June to track analytics on features post-deployment. In addition, it enables Hive to find the right group of users for user research. Both add a lot of value towards developing next iterations.
Product teams use June to stay well connected to what they have built and have the ability to easily include other workstreams. Discussing and brainstorming over the data helps their teams work together, creates motivation, and ensures working towards the same goals.


