


Reveal is using June to break down companies into different segments on the basis of their behavior. In this way, it's easier to track how those are moving from one state to the other. Every company needs to start getting and providing value to the network as soon as possible
The background
In a competitive and crowded market, B2B businesses should find alternative ways to make revenue.
Reveal believes that partnerships will become the #1 source of revenue in B2B. In their platform, companies can identify shared revenue opportunities by syncing their CRM. After that, accounts can collaborate with each other to increase revenue.
Reveal started at the beginning of 2020 and recently raised a $50M series A round.
The challenge
The value of a service like Reveal relies upon its network of companies. For this reason, they need to unblock accounts as soon as possible. In this way, network effects start coming into play.
Every company is important for Reveal to build a great network. Accounts have to perform a set of actions to start getting value from each other. However, following each journey manually is pretty expensive resource-wise.
A simple way to track this progress was needed to enable the team to act with perfect timing to make sure every account becomes successful.
Reveal LTV per customer is high. Monitoring the state of every account is crucial to support strong revenue retention.
The solution
Segmenting companies
Perrine wanted to understand what a successful journey in her product looks like. She looked into the key actions that led a generic account to become a paying one.
At first, Reveal did that by looking into session recordings one by one and listing every action performed.
After following this process a couple of times, Perrine came up with an accurate picture of what a great account journey looks like.
Yet, following every account individually and pushing it toward the desired path is very time-consuming, especially as the number of companies registered grewed to thousands quite quickly due to the network effect. Reveal decided to explore product-analytics solutions to track progress at scale, focus people's efforts where needed, and make informed product decisions.
This approach reduces the time-to-value for their customers and increases the revenue generated.
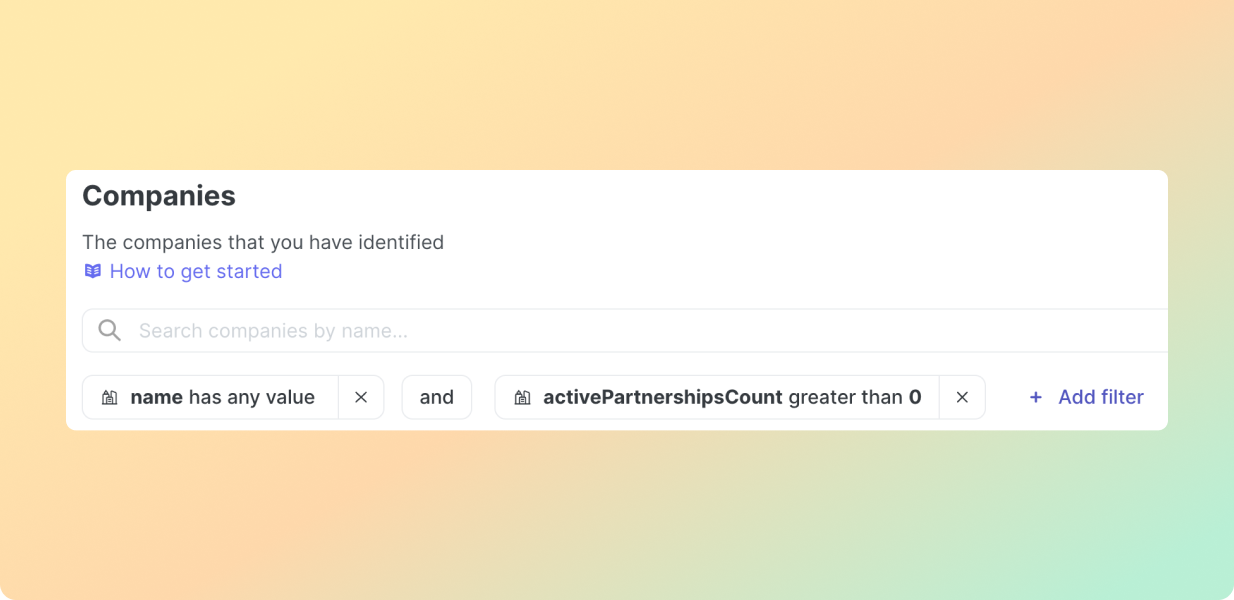
At first, Perrine broke down the account journey on the basis of specific information about the behavior of its members. This segmentation uses a key action accounts should do: activate a partnership.
Such an indicator has a positive correlation with retention and revenue. Thus, it’s used to “rank” accounts. Perrine uses specific thresholds on the number of activated partnerships to create the ranking. This data is stored as a company trait.
Reveal breaks down their accounts into categories such as:
- Registered accounts
- Onboarded accounts
- Promoters
- Paid customer
Monitoring state transitions
The goal for Reveal is to make companies progress from one group to the next one as soon as possible.
As such, Perrine’s team monitors the account's “status changes”. Every change has a different meaning and leads to different actions the teams need to do. Good visibility on account transitions helps the team deliver relevant resources to users with the right timing.
For example, a change of value in the variable “the number of active partnerships” is a signal for the team. Depending on the value reached, a company can inform the company it is the right time to open an opportunity.
At this stage, salespeople spring into action to understand the needs of the account. Team initiatives shift from success to sales motions.
Tracking of key product KPIs
As a freemium product and a network model, Reveal has to build a product users love, not only a product that people buy. To make sure they’re always adding more value in the product for their users, Reveal monitors closely the stickiness of the product.
- 1. Weekly Active Companies / Weekly Active Companies: They focus on returning users only, so that the impact of marketing activities that bring new sign ups do not bias the data. As a B2B business, being able to monitor it at the company level and not as the user level is super important.
- 2. Stickiness (WAU/MAU) As a B2B business Reveal isn’t meant to become a daily usage product. A “good” frequency of usage would be weekly, which is why their objective is to keep the ratio of Weekly Active Users / Monthly Active Users over 60% and to keep increasing it.
Data informed product decisions
Everyone claims to make only data-driven product decisions. But what does it really mean?
Running the same analysis on different audiences is the best way to understand the differences between these groups. For example, it allowed Reveal to establish that the retention of companies using a CSV of GoogleSheet file as a data source, was similar to the companies using their actual CRM as a data source, which means that both experiences of Reveal are equally appreciated by the users and that it made sense to invest more on the GoogleSheet and CSV integrations.These findings are helpful to adjust strategies and initiatives.
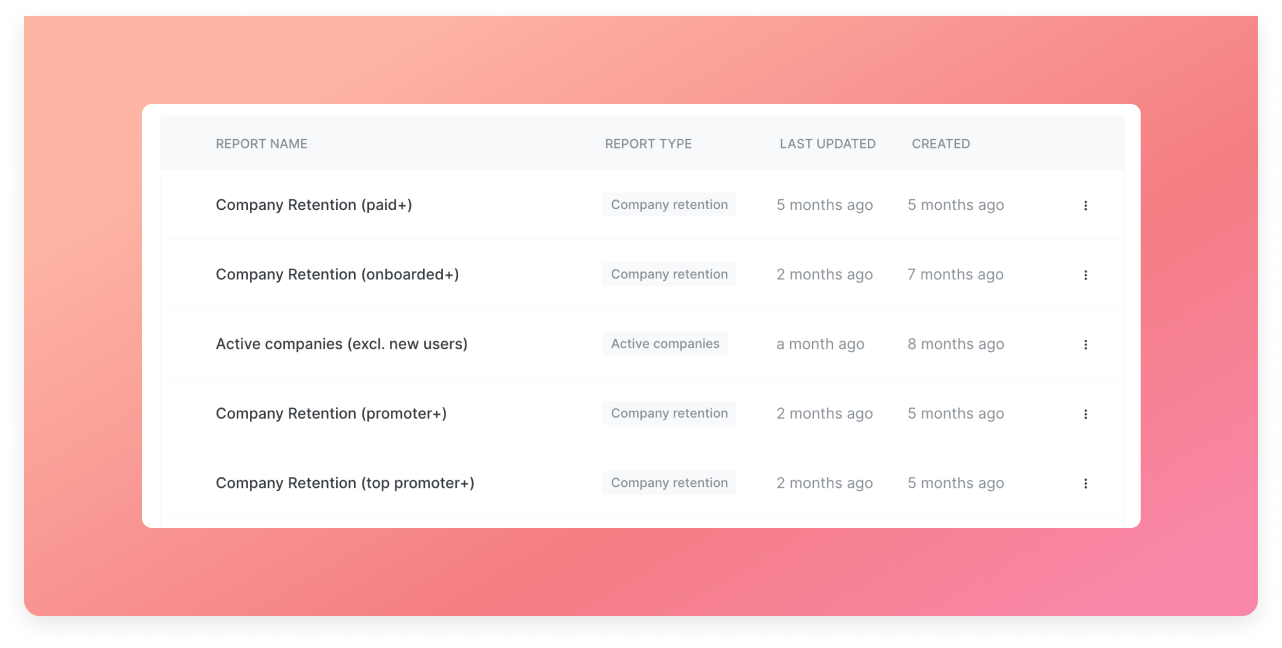
Check-in on Paid Account health
Reveal also checks in on the accounts that are already paying. A retention report helps them track whether they are still getting value from the platform. Retaining paying customers is crucial for healthy revenue cohorts. This is very important for Series A companies with high account-LTV.
The outcome
Thanks to a detailed tracking plan and simple reports Reveal is now able to be on top of the rapid growth of its network of users. Monitoring at which stage companies are at is a couple of clicks.
This enables the team to be super responsive and not to lose precious opportunities. Paying accounts are also monitored closely to reduce churn.
Reveal is scaling its business by combining data-driven prompts with effective human interactions.


