


Intro
Correlated helps product-led companies convert more users into customers. Product-qualified leads (PQLs) are identified right when they are ready to convert by analyzing product usage data. Diana is one of the co-founders and has been an active user of June since the very beginning (she also provided wonderful feedback 🙏).
Diana and her team leverage usage data to build a sticky product, then grow their audience. Here is their story!
Background
Correlated was founded in 2020 and raised $8.3M in seed funding.
In a product-led world, potential customers expect to first start experimenting with the product via freemium plans or free trials before talking to sales. For this reason, “Sales needs to know how customers are using the product and reach out at the right time for sales to engage based on the maturity of the experience” Diana’s co-founder Tim Geisenheimer said.
Correlated pulls product usage data from various applications or data warehouses and combines it with firmographic data about customers living in CRMs to provide a full 360 view of customer data.
Then, it identifies PQLs most likely to convert and allows users to create fine-tuned GTM playbooks to automate follow-ups. For example, you can use Correlated to route Enterprise PQLs to sales reps, while sending SMB PQLs to email automation tools like Hubspot, Outreach, or Salesloft to automatically reach out.
By connecting product usage data with downstream applications, PQLs can be effectively discovered and delivered to the right teams who can act on them.
Correlated is now a team of 18 and their customers include Series A+ companies such as Reveal and LeadiQ.
The challenge: increase activation and retain customers
Diana is the co-founder and Head of Product at Correlated. She needs product usage data to make sure that:
- Her team builds simple and intuitive products that their users can start getting value quickly
- Once users convert (Correlated is using their own product for this) they’re constantly getting value from the service
The Solution
Measure and improve activation of all users
To start getting value from Correlated, users have to accomplish a specific set of actions.
Specifically, users should connect a data source like Segment or Snowflake and then a destination like Salesforce or Hubspot. This is what Diana calls “the setup checklist”.
After that, comes the “Aha moment” which in SaaS refers to the moment when a user understands the value of the service.
For Correlated this is when a user sets up and saves some sales signals. Basically, a signal is a set of actions/conditions that signify that a user might have buying intent.
Lastly, the action that stands for proper activation is when users run an automated workflow.
Diana wants to understand at a glance how many users are hitting these early goals. This helps her identify where users are struggling the most, as well as measure the impact product development projects have on activation.
She does that by setting up the following milestones in June:

Aggregate behavior is not enough for Diana to build a great product. Being able to dig into exactly what new users are doing is also important for building better UX flows.
Diana receives notifications via Correlated whenever a new user signs up, and if the new user is from a target account, she’ll manually dive into the New Users report to check whether the milestones were accomplished or not. This process is particularly important for the first users of an account!
Milestones completed appear in the bottom right corner of the user pages:
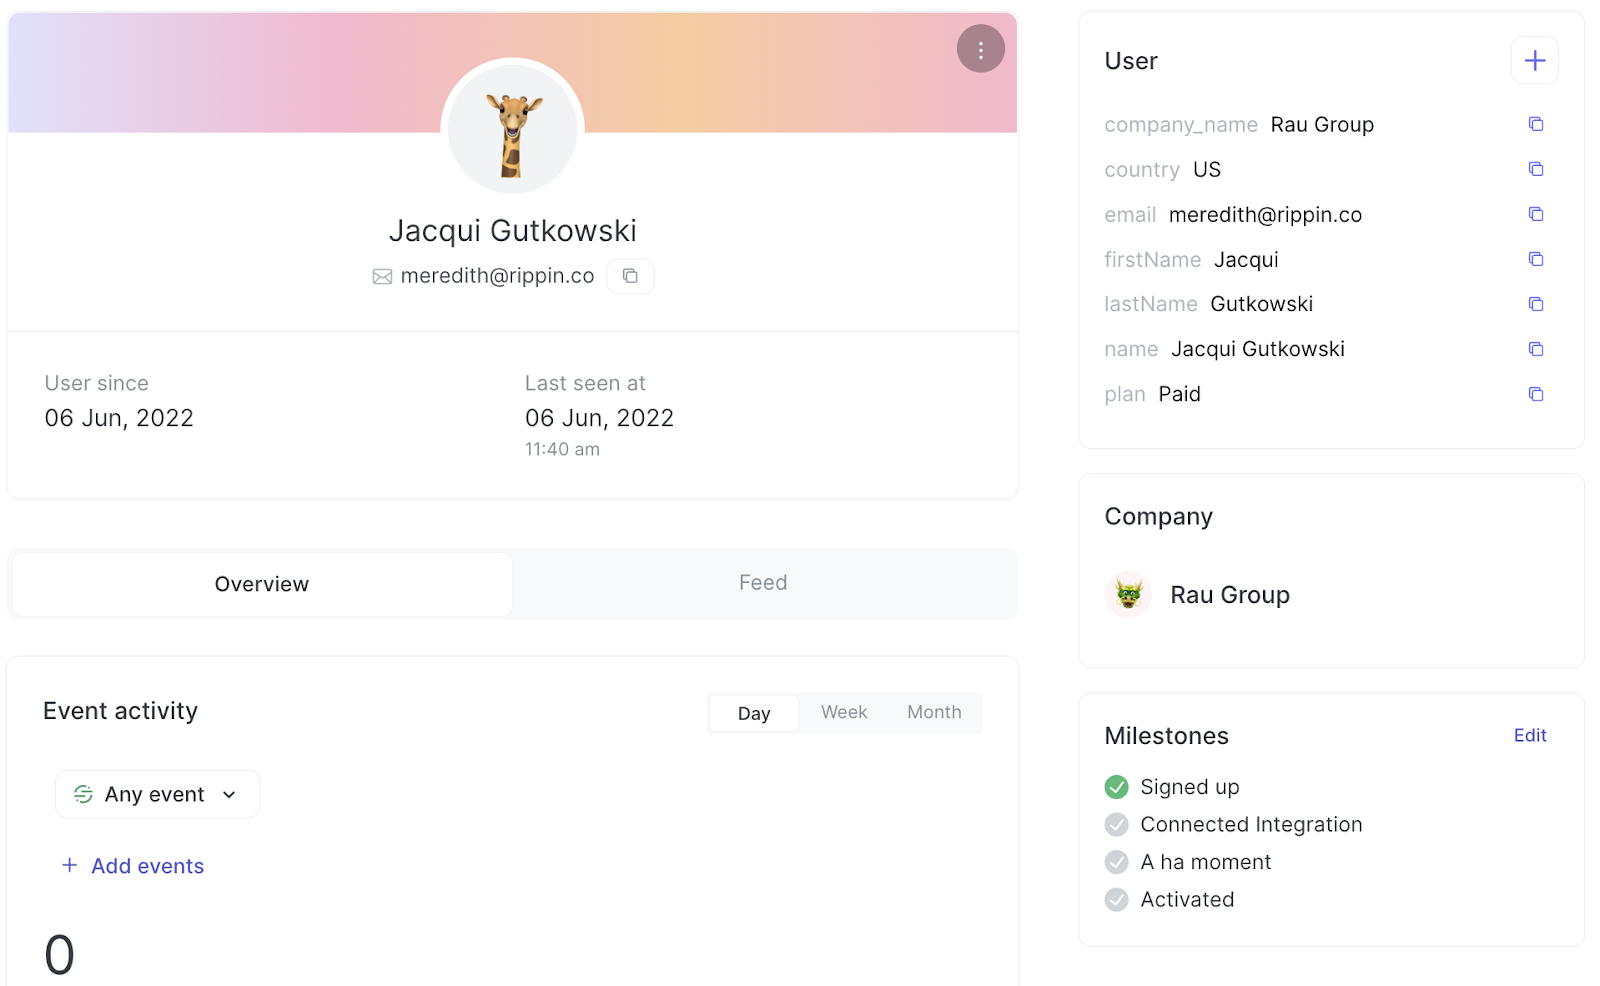
If users get stuck, Diana and her team will reach out to identify what happened.
This is a great way to discover issues with the product onboarding that would be otherwise hard to find. It was these discovery conversations that helped guide the onboarding experience new users see when they get started with Correlated.
As you land into the product, you’re first asked to invite a teammate who can help onboard data. You’re then guided to connect a data source, and then finally build a Signal.
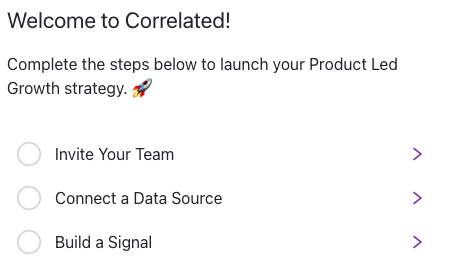
Iterating on the first session experience has resulted in a 40% QoQ improvement in onboarding completion.
Monitor feature usage to ensure customer adoption
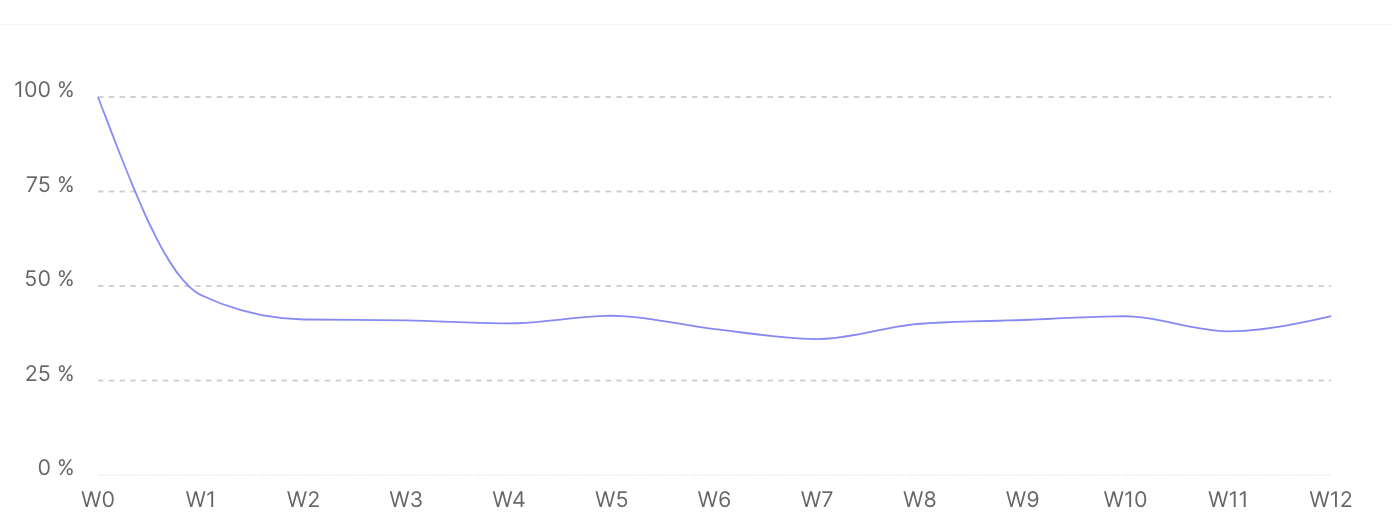
After fixing their activation (retention in the first 14 days) Diana and her team looked into their long-term account retention: Diana wants to make the curve as flat as possible after W1.
This means most of the accounts that activate would continue to come back to the product. This is the kind of curve they aimed for:
Improving retention meant that Diana and her team needed to understand what features were being used the most so that they could push all customers to adopt those features.
For example, using the Feature Audit report, Diana noticed that users were viewing the Account and User Detail views, but weren’t interacting with the Account and User Lists, which are powerful ways to discover prioritized lists of Accounts and Users based on product usage.
This insight led to some customer interviews where active users mentioned that they simply didn’t understand the buttons on Account and User Lists, so they weren’t sure how to use it. With Correlated’s most recent update to those views, usage of Account and User Lists have more than doubled.
Diana and her team were able to use June to find areas of improvement and measure outcomes.
Diagnose issues with key accounts to drive retention
Although Correlated has a free-tier, they also serve large enterprise clients with high account LTVs.
Company Retention over time is critical. Since Correlated allows users to automate PQL playbooks, one of the most important KPIs is how many workflows a company is running at any given point in time.
When users do not run workflows they are not taking full advantage of the product. This means that churn risk increases.
Diana uses the Company Retention report to track Workflow run action retention over time. At a more granular level, Diana and her team receive alerts powered by Correlated when key target accounts enter the product and use important features (for example, they created a Playbook or added a Goal to the Playbook).
When any of these alerts merit further investigation, Diana and her team use June’s company-specific views to identify what users did and track their progress as they use the product. This allows the Correlated product team to not only monitor Retention at a holistic level across all customers, but also dive into Retention at a per-company level.

The Outcome
Correlated started using June during the early days (end of December 2020).
Since then, the product evolved a lot but the principles and goals remained the same as every pre-product market-fit SaaS company: make an intuitive product with great activation and retention.
Correlated has significantly improved activation and is now focusing on retention. June makes it possible to figure out how to improve retention and measure whether or not product initiatives have an impact on retention.
Correlated uses June to identify areas of product improvement, reach out to customers using those product areas to solicit feedback, and measure the outcomes of product development work on customer happiness.


