


According to Statista, SaaS is projected to have a market of close to $195 billion by 2025, representing an increase of about 107% from 2020. Clearly, the future is bright for SaaS, and it’s not too late to get in on the action.
If you’re looking for a digital toolkit for your SaaS business, it’s easy to get lost with so many options to choose from. FullStory is one such example, and it is half of our focus today. But would it improve your site stats and recurring revenue as well as a digital toolkit specifically geared toward B2B SaaS? Moreover, would it be the most cost-effective solution?
Today we’ll be reviewing FullStory and explaining how it, as an analytics platform, can help companies take the next step forward. We’ll then explain why June is a great alternative especially if you're an early-stage B2B SaaS.
If you’re seeking a great FullStory alternative, you want a toolkit that offers the following:
- Increases your retention rate
- Helps identify ways to improve your product
- Helps you spot where you’re going right and where you’re going wrong as a SaaS
- Good bang for your buck
- Not unnecessarily complicated
While FullStory is a comprehensive solution to tracking customers and garnering analytical insights, it is designed for a wide range of businesses and is pretty expensive. That’s where June, a great FullStory alternative, comes in.
We are a SaaS-oriented FullStory alternative with affordable pricing and in this guide you’ll learn what we have to offer and why people have chosen us. Let’s go!
June vs. FullStory: Key differences
Target audiences
As mentioned, June is made exclusively for those who run an early stage (up to series B) SaaS. Our focus is on helping you to get to product-market fit.
Enterprise teams use FullStory, such as those in the retail, finance & insurance, travel & hospitality sectors to optimise they UX.
Use cases
June is focused on reports such as User Retention, Funnels, Active Users and Feature Analysis.
Fullstory it's more about founding faults in the user experience through data analysis. It also provides screen recording and heat-maps to debug what went wrong.
In short June helps early stage SaaS companies steer their strategy to build a sustainable business. This is possible thanks to retention and activation analysis as well as feature comparisons. Fullstory is more about optimizing UX.
Lightweight vs. heavyweight
June is a lightweight product analytics toolkit. While we offer fewer features in total, our service is more affordable and is more intuitive.
FullStory will give you far more data such as frustration signals and tagless autocapture, but likely more than is necessary for most B2B SaaS products, especially if you’re just getting started.
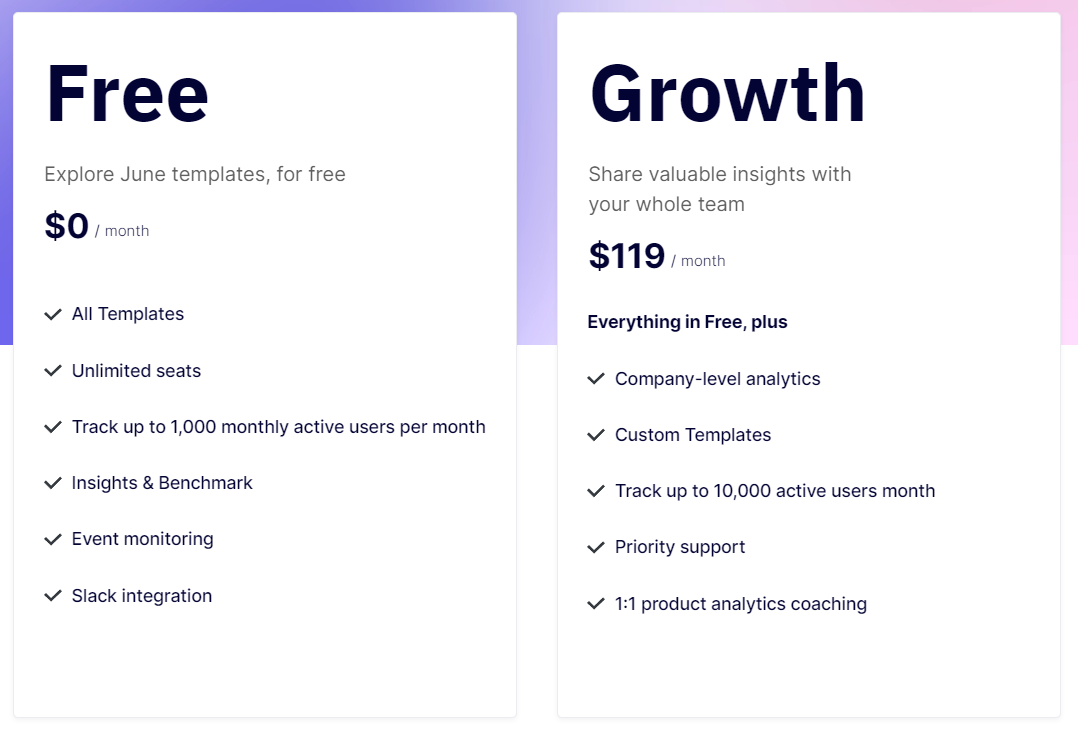
Pricing
As touched on, June is much cheaper than FullStory. The latter starts from several hundred pounds per month, whereas June is available in a free version and a $119 a month Growth package.
What is FullStory?
FullStory is a prominent digital experience intelligence system. Its purpose is to merge qualitative and quantitative data to help you solve issues, find answers to your concerns, and perfect your customer experience.
The company launched in 2012, founded by a collective of former Google engineers. After launching a different product, FullStory’s efforts to understand how customers were using their initial product inspired the idea for FullStory’s digital intelligence system.
In a 2018 JotForm interview, FullStory’s CEO, Scott Voigt said of customer experience that “it’s the MOST important thing over time. Because consumers and product users are the ones who are making the decisions on the product”.
The key SaaS clients of FullStory:
FullStory’s key features
Tagless autocapture
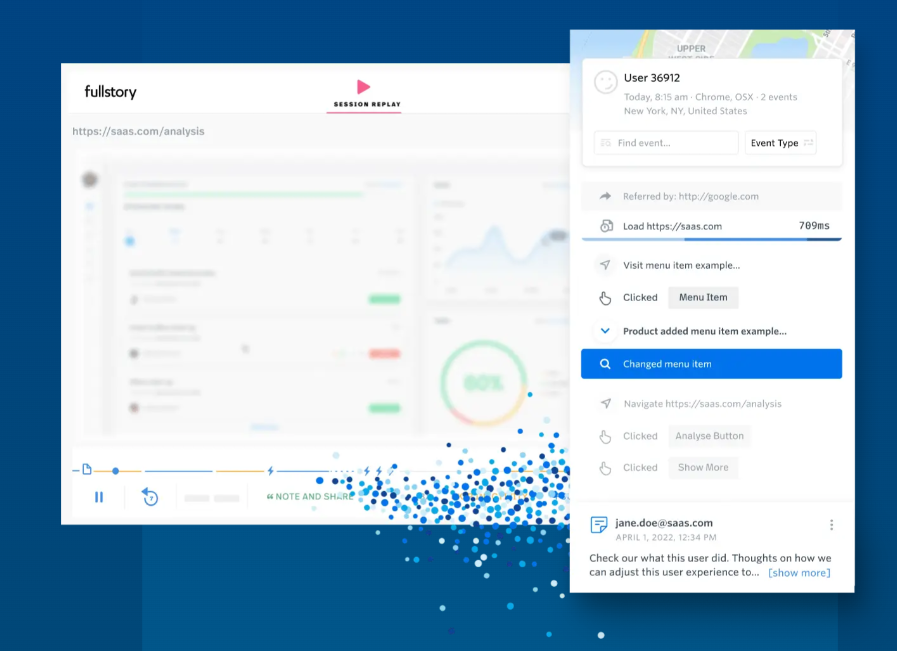
This feature allows SaaS companies to track every action taken by any given user. It achieves this by retroactively capturing whatever a user sees. Long-tail data gives you the full user experience.
Frustration signals
This feature is a great example of the intelligence of FullStory’s digital toolkit. Frustration signals of unhappy customers. This can make it easier to spot issues that are leading to lost revenue.
This feature can:
- Identify priority fixes
- Provide red alerts for user frustrations
- Explain how you can fix a given issue
One example of a frustration signal is rage clicks. This, as you might guess, is when someone clicks or taps (if they’re using a phone) on something multiple times out of frustration, such as a link that’s not working or is failing to respond in a timely manner. Detecting issues like rage clicks is a great way of fixing up small problems that could be impacting your customer’s UX.
Journey mapping
Put simply, journey mapping is the process an individual undergoes to reach their goal. In the context of web users, this feature can help you transform how you test, measure, and iterate.
First and foremost, FullStory’s Journey Mapping feature can enable you to spot trends faster. It can achieve this by giving you a clear picture of the most common paths customers take through your product. Journey Mapping can also help you pinpoint where things are going well and where there are roadblocks in each customer’s journey.
Moreover, this feature can merge data analysis with real customer experiences to understand why they are taking certain paths.
Heatmaps
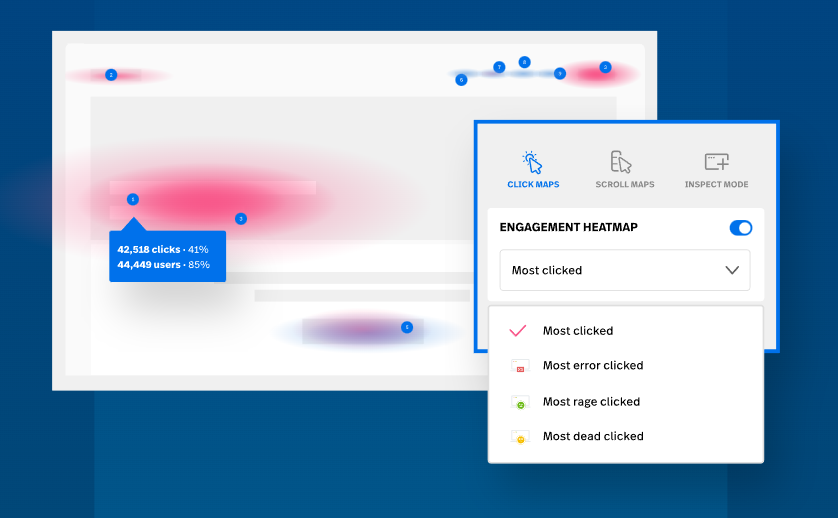
A heatmap is a fantastic way of making sense of user engagement. It shows how users interact with different aspects of any given web page.
FullStory’s Heatmaps can help you:
- Notice what is catching the attention of your users
- See what elements of your site customers are using as expected and which ones they are neglecting
- Find areas of your site you ought to optimize based on a lack of user interaction
Pricing
Reportedly, pricing for FullStory starts from $899 per month, albeit you could avail of a free trial if you’d like. FullStory offers Enterprise and Business packages. The latter is available with a fourteen-day trial, while you could test either with a FullStory demo mode.
As you can see, the Enterprise package is the more comprehensive of the two. However, both offer tons of advanced and intelligent features.

Pros and cons
Pros
- Advanced and intelligent features
- Comprehensive and effective solutions
- Allows you to address practically any potential issue with your website/service, ranging from the large to the microscopic
- Offers a wide range of integrations
Cons
- Expensive option
- Not designed specifically for B2B SaaS
- Possibly more than what you would need
What is June?
At June, we are helping product teams build better products on the basis of user behavior data. We are doing so by providing you templates for all the main metrics a SaaS company should track.
You can set up June in only five minutes and start providing relevant insights for everyone on your team.
We offer 15+ templates allowing your team to move quickly and ensure high customization. Our templates are essentially features.
Here are some of the awesome fast-growing companies that use June:
June is an award-winning digital toolkit.

June is also backed by Y Combinator, a funder of early-stage startups. If you want a toolkit that keeps things simple and that helps you find product-market fit then you should give us a try. We provide you with actionable insights and customized reports in a matter of seconds.
Some of June’s key features (templates)
Feature audit
Put simply, a feature audit analyzes your product and evaluates which features customers are using. This template can tell you the popularity, use frequency, and usage intensity of the various features of your website. Moreover, it can also tell you how many people use said features.
User (or company) retention
This is another very useful template as it tells you how many users are still using your product at any given point. It comes with a retention graph and acquisition cohorts. The latter basically breaks up your users into cohorts based on when they signed up and how active they’ve remained.
One of our customers Multis, a crypto-oriented SaaS, loves this feature. They’ve utilized our toolkit, including retention metrics, to focus on what matters at the right time.
Top feature users (or companies)
This is an interesting and useful template that informs you as to who the top thirty users are for any given feature. This might be especially helpful if you are just getting up and running as a B2B SaaS. It gives you a sense of what users you might want to reward for being so active and what users may need more encouragement or incentivization to use your SaaS more often.
It can also be used to identify leads that are likely to convert to your paid plan.
Active users
If you’d like an overview of active users, this template is for you.
This template offers the following metrics:
- Daily Active Users - The number of unique users who use your website daily.
- Weekly Active Users - The number of unique users who use your website weekly.
- Monthly Active Users - The number of unique users who use your website monthly.
- DAU/WAU - This calculation of DAU divided by WAU tells you how many unique users access your SaaS for two or more days out of the week. A good DAU/WAU for a SaaS is about 60% or more.
- DAU/MAU - Another calculation worth considering. You want a DAU/MAU of approximately 50% or above.
- WAU/MAU - You want a WAU/MAU of around 60% or more.
FullStory can also provide active user data, including real-time reporting and click tracking, although June keeps things simple and tailored toward SaaS.
Slipping away users
This template can inform you of up to thirty users who are drifting away from your product. This gives you the chance to reel users back in with incentives such as discounts, enhancing their user experience, or by sending some other enticing newsletter.
Feature release
If you’re releasing a new feature, this template can help you a ton. The feature release template tells you how many people have adopted your feature along with its daily, weekly, and monthly use metrics.
Development SaaS Waldo is a big fan of our feature release template. Monitoring metrics such as the performance of their feature releases have helped Waldo evolve. They are now more data-driven than ever.

FullStory Vs. June: feature comparison
Reasons why people choose June over the competition
You’ve read our case for choosing June, but what do our customers have to say? Let’s look at some of our customer success stories.
Soda
Soda is a data reliability and quality platform that enables data teams to fix data issues by finding, analyzing, and resolving them. Soda’s challenge was to build a cloud data quality platform that would be a hit with their users. By utilizing June, Soda could determine what made their product sticky and what didn’t, allowing them to fine-tune their product to maximize success.
TheyDo
As a customer journey management tool, TheyDo aimed to construct a fantastic self-served product while converting and retaining high potential leads. With June, they achieved this by improving product activation, measuring PMF for self-served users, and figuring out what features were popular, among other steps.
Waldo
Another SaaS that benefited from June is development service Waldo. They use June to measure how successful their latest releases are and to access high-level product performance indicators.
Final thoughts
Today we’ve reviewed and compared digital toolkits June and FullStory. Both are great toolkits for SaaS companies; however, June is designed specifically for those running an early-stage B2B SaaS. FullStory is a great option if you want highly advanced data but may be far more than you need to optimize your website and UX cost-effectively.
Still, screen recordings are a valuable resource also for early stage startups. Combining them with June's reports will give you a complete picture. For this reason we advice you to adopt, in parallel with June, Microsoft Clarity for session recordings and heat-maps. It's free and results are pretty good :)
Sign up with June today and utilize our toolkit to make your product better!
If you want to learn more about how you can optimize your B2B SaaS and move forward as a team, take a look at our blog, where we explore topics such as our tips for churn analysis and how you can set up a clear product goal.


