


Growth is inherent to start-ups. Nothing starts, and there’s no company unless people are signing up and on track to pay you. But when and how do you start hiring for “growth,” and what does that mean in a post growth hacking, post-SVB world?
We talked to Darius Contractor of Otter.ai, Airtable, and Dropbox, about growth, what he’s learned, and how you can get it right in 2023. We’ve also gone ahead and created product analytic templates for you in June so you can import these reports into your account in one click.
Read on for expert strategy and expert tools so you can create your own growth strategy yourself.
When to focus on growth
At June, we’re focused on startups and supporting them with out-of-the-box analytics. But that’s not to say that all of our customers should focus on growth optimization right away. It’s an industry best practice for startups to find product-market fit before you pour fuel on the proverbial fire.
And how do you know if you’ve found product market fit?
Marc Andreessen defines it as a feeling of sorts, a momentum: “The customers are buying the product just as fast as you can make it -- or usage is growing just as fast as you can add more servers. Money from customers is piling up in your company checking account. You're hiring sales and customer support staff as fast as you can,” as quoted by Y Combinator.
But of course, you have to have product analytics in place and be monitoring them to have awareness of this idea.
For Darius, that looks like usage and engagement metrics.
“[Product-market fit’s] where people use your product, they really love it, and they want to come back and use it more the next day, ideally. And some of the best signals are retention and also people paying for your product on an ongoing basis and retaining them as paid users. So if you have that, then it often makes sense to start working on growth. It makes sense to try to get more people into that relationship and share your product value with a wider audience” he said.
Here’s how you can start to measure that with June (or another tool).
Daily active users
Retention
Your key metrics
When you start to craft a growth strategy, many teams like to choose a key metric or product action that they’re trying to get customers to.
It’s nice to think of this as the “ah-ha moment,” or as AppCues puts it, “the aha moment is a moment of sudden insight or discovery. In software, it’s the pivotal moment when a new user first realizes the value of your product and why they need it.”
It’s generally the moment you need to get visitors aware of to incentivize signup and possibly payment.
AppCues offers a few thoughts on how you can start to empirically find your ah-ha moment.
How to use data to find your ah-ha moment:
Put together a list of 10 to 20 behaviors (or a combination of behaviors) that correlate to retained users. You're looking for a set of behaviors exhibited by users who stay and not behaviors exhibited by users who leave. That means behavior exhibited by:
- Most retained users AND most churned users = no correlation
- Just a few retained users AND just a few churned users = no correlation
- Most retained users AND just a few churned users = correlation
A correlation between behavior and retention is your first clue that you're on the right track, but it isn't everything.

Conversion copywriters are also hyper-aware of this moment. In all top-of-funnel activities, a conversion copywriter is driving interested visitors to the ah-ha moment or possibly creating lifecycle marketing materials that support the user journey from signup to payment. One tool they use to pinpoint the ah-ha moment is to run specific customer interviews that ask for it.
Ashley Hockney, previous Director of Marketing at Buffer and product-led marketer, shares her questions for her interviews here.
This moment should work in tandem with your company’s core metrics.
Your core metrics are the key metrics you want to move to grow your business. They’re highly strategic and are likely identified and affirmed by leadership. This might come in the form of OKRs or other phrasing, but the idea is always the same: all teams are rallied around a key growth goal.
For example, when Darius was at Airtable, much of the team was focused on activating users, which was defined as people who successfully used Airtable, stuck around, built a base, invited their coworkers, etc.
“Waterfalling from this goal, the main metric (or what we’d call the North Star metric) at that time was getting people back in the fourth week and having fourth-week multi-user active (meaning two people using a workspace in the fourth week). That meant that they not only tried it, they not only played around at the site, but they actually invited someone. And then both of them were using it even weeks after they signed up. That would be a pretty good indication that they're ramped up and going with the product,” he said.
June’s particularly well suited to analyze this kind of metric. One of our unique qualities is that we make it easy for companies to look at analytics for both individual users and companies as a whole. This means it’s quite easy to look at the number of activated users within one company in your database.

So, in support of Airtable’s North Star metric, Darius and team did a few things:
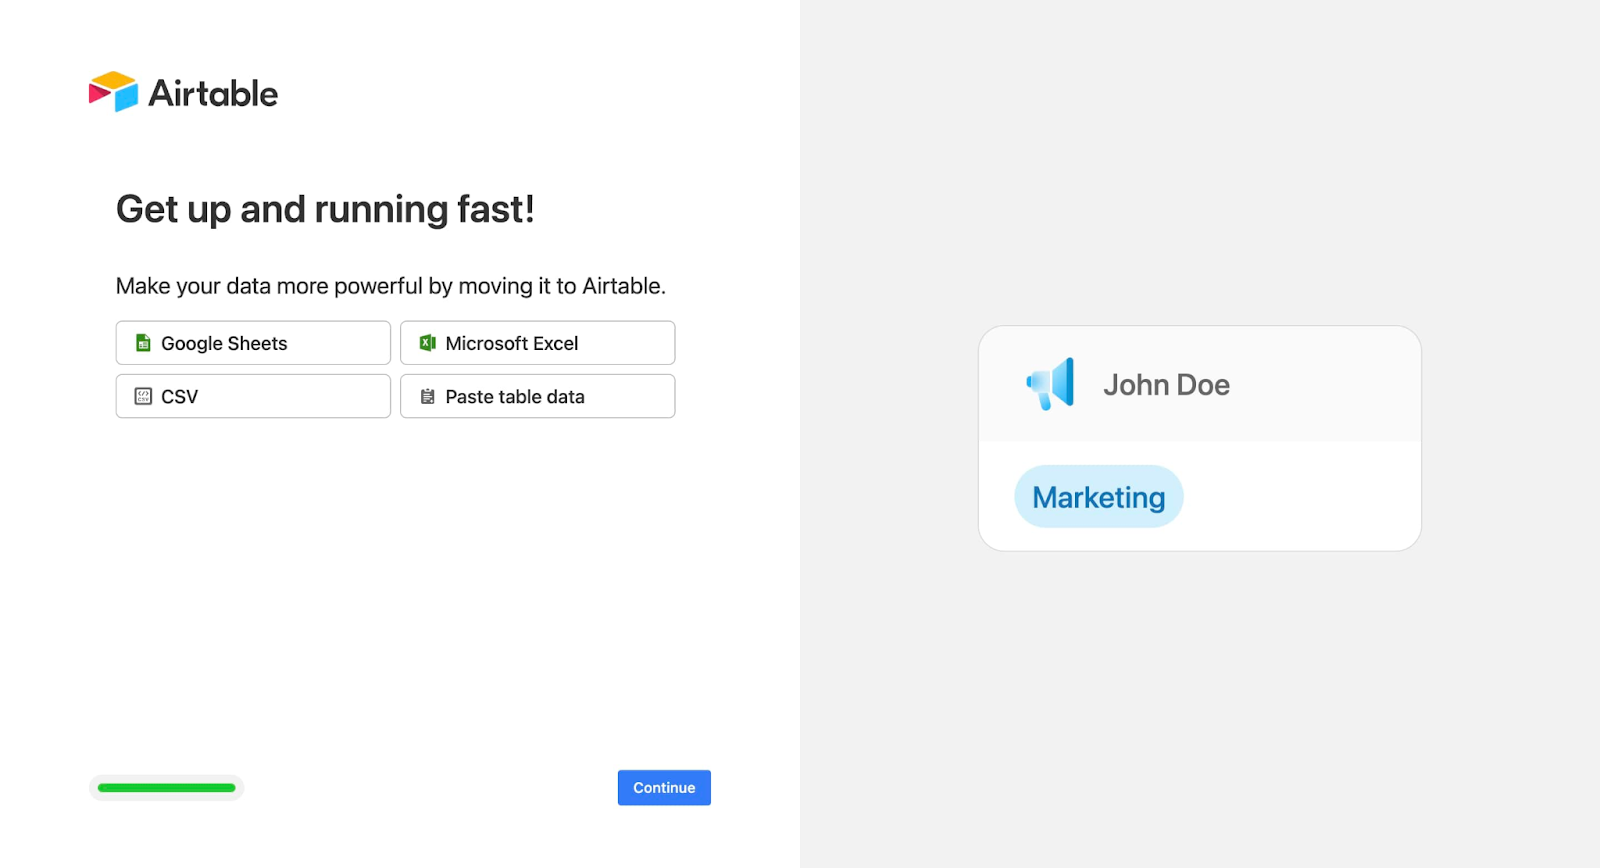
“Looking at the current numbers, we saw that a number of the people who uploaded documents did a lot better on Airtable. If you uploaded your own spreadsheet and looked at it in the Airtable format, there's a good chance that you kind of fell in love with Airtable and kept using it. So we thought, why don't we try that out in the onboarding flow? So we changed the onboarding flow to encourage people to upload documents and really make it front and center rather than kind of a sideline option. And we did find a lot more people would upload documents, and then we did find those people would actually stick around and convert at higher rates to activated users and, if I remember correctly, monetized users as well,” he said.
With June, you can start to look at how individual product features impact downstream engagement and monetization in a few ways. Including with an overview of your features and their usage:

What metrics should you measure?
As you grow, you’ll start setting up product analytics to help you monitor the health and growth of your business.
We asked Darius about what metrics he measures, specifically for product-led growth companies. Here’s his dashboard if you’d like to make it your own:
1/Retention: When I come into an app, the most important thing really is retention. Do people who show up and use the app stick with it, do they love it? And if so, the next question is monetization. If they stick with it and love it, do they also pay for it, which is also, in some ways, a signal of retention that they find value in it enough to pay for it and also paid retention.
2/New users: The next most interesting and powerful metric is like top-line growth of users. Are people coming into the product which if the other things are true then it'll probably 1s connect with monetization, although it might not.
3/Activation: The next question is activation. If we have a great experience that some people retain on what percent of your new users are activating that experience and really then if you get retention, right, and then activation, right, then you get top of funnel, right, then you've got just like highly retentive product that's growing quite well.
4/Monetization: Although all these kinds of things you don't just want to do that like 1234, you probably want to do a little bit of one then a little bit of the other. Kind of get all the plates spinning and all parts of the flow like somewhat healthy and then go deep dive and optimize them even further.
We wholeheartedly align with Darius’ mentions here. In fact, all of these come out of the box and ready for you to use when you activate your June account.

Building a growth-focused team
Zooming out, growth isn’t just about your strategy and analytics, it’s also about hiring and empowering a team to be data-minded and able to execute your growth strategy.
A tenant of Darius’ career is that he calls himself a “growth engineer.”
“Growth engineering is a technical field pioneered by Facebook about a decade ago which also exists at Netflix and Jira (Atlassian). It’s a technical and systematic approach to growth. Growth engineers constantly brainstorm new ideas and experiment with metrics and data to improve conversions and user experience. Simply put, they track everything to understand what works and what doesn’t,” says User Guiding.
Similar to engineering-led development, it creates a hybrid role for an engineer where they’re not just responsible for building but for strategizing around what they build. As you can imagine, when you cut out a team of product managers, growth leads, data scientists and more, things move faster and more rapidly.
“I know a lot of great product leaders who come from design, product leaders who come from business, and obviously they have different kinds of superpowers as far as the ability to make things happen in their role. But being able to kind of really get into the details of the product and the engineering of how it works is one thing that I think I bring. There's also just a focus on data and numbers that serve me well on the virality side of being able to look very closely at numbers and also run my own database queries, which is maybe less unique now. But certainly, when I started my career, it was only engineers running numbers, and then that allows me to get deep into viral flows and really optimize things in a way that often you can't if you're just looking at it from a design perspective,” Darius said.
Growth engineering is one of our favorite new roles gaining popularity in the startup space today. While marketers, product managers, and designers have all grown in technical competence in recent years, there’s nothing like an engineer who can bridge empathetic strategy with superb implementation abilities. This allows for rapid iteration on key growth properties from your homepage to signup and checkout flow. It also means that when there’s an opportunity to quickly add viral growth loops to your product, they don’t end up in a Jira board, but are implemented as soon as they’re spotted.
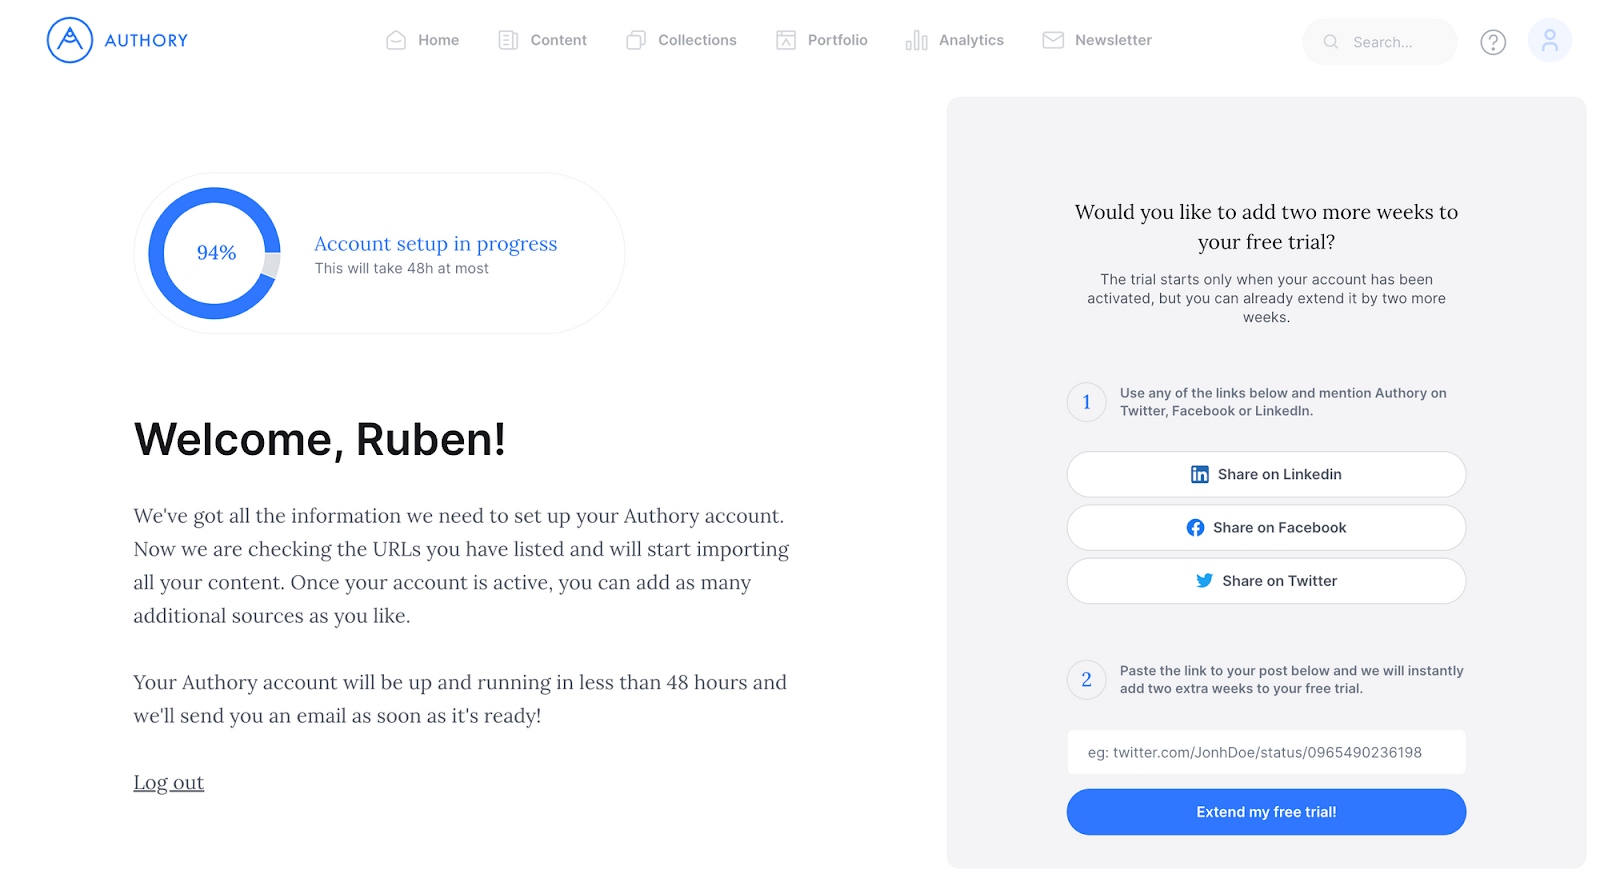
Take, for instance, this signup screen on a product like Authory. The screen on the right helps create virality and sharability within the app. However a marketer generally doesn’t have access to the backend, so an addition like this could end up in Jira for multiple sprints. Building this into the product from day one is simply more efficient.
This also rings true for every screen in your customer lifecycle. With growth expertise, it’s easy to see how to nudge someone toward the important next step, whether that’s engagement, activation, or sharing.
Now, not every startup can afford to hire a growth lead out of the gate or someone like Darius. What you can do as a leader is create a data-focused culture and support them with tools that make it easy to do their job.
“For a growth team to really function well, you do need an engineering team associated, ideally you have a few PMS who can locally own the projects. You really do need a more mature data stack than a lot of very early companies have. You need good tracking and clarity and tools like June, so you understand what I'm using, 1s what's happening to users, and what their experience is. And then with all that together, you can start to grow.
The Darius Contractor Guide to Growth Experimentation
If you look into the growth space at all, you’ll find that prioritization tools are common. In a list of experiments, how do you choose one over the other?
A common framework for this is the ICE framework.
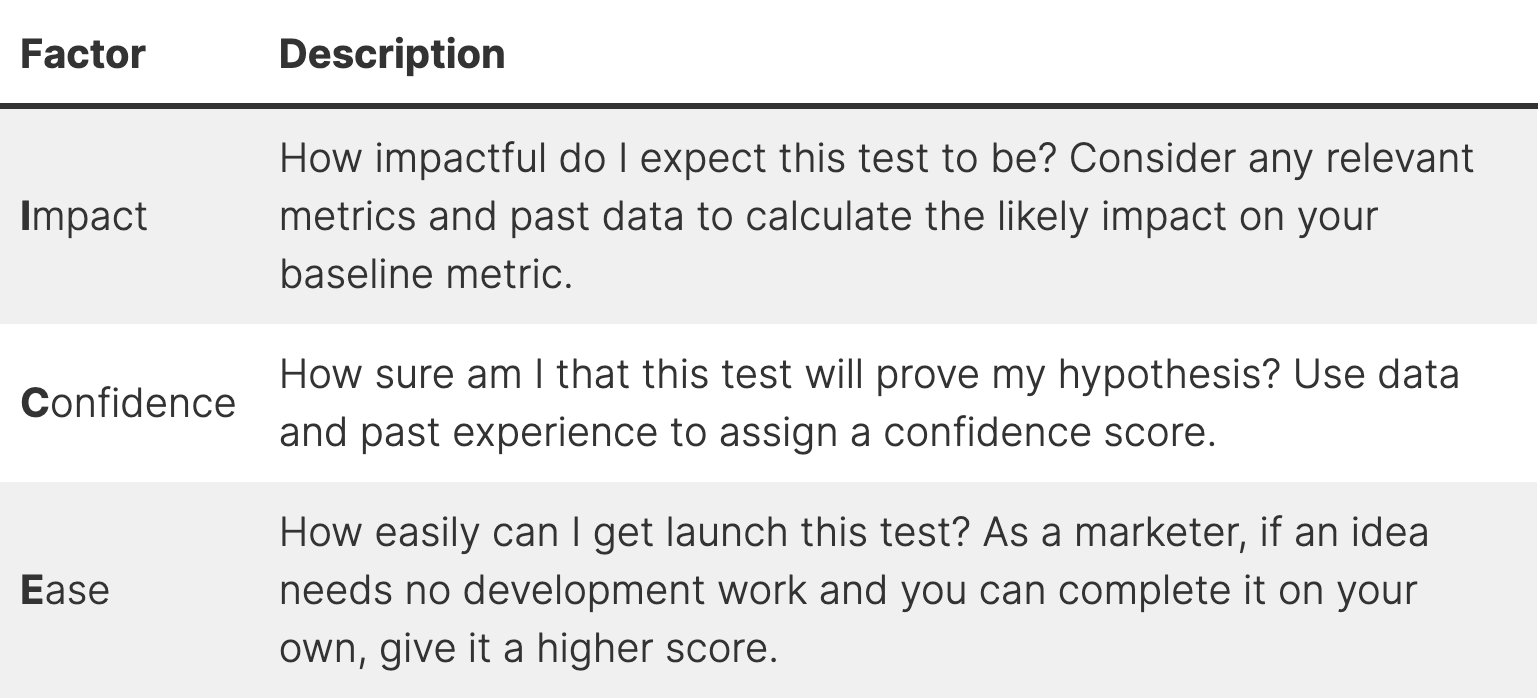
Assigning points to Impact, Confidence, and Ease allows for numerical prioritization.
Much has been said about ICE and other frameworks,, but there are a few key things that have to happen to get it right. First and foremost, your team needs a clear goal (sometimes, this comes in the form of an OKR).
For example, you might have an activation team with the goal of activating new teams on the platform, like a bunch of people from the same domain who are all using our app together.
Darius would suggest breaking down this goal from year to by quarter, so for example, for every given quarter, do the projects that help move that goal as much as possible with the least amount of effort. It’s a similar ROI calculator as what you’re seeing in the typical ICE framework but also aligned with the ah-ha moments and OKRs as we’ve discussed above.
Let’s get deeper:
“Believably, if we did this project, what would change in the product? And then how would people's behavior change such that it would meet this goal? And so if there's one page, we're going to add a button, 10% of people are going to click on that button. Half of those people are going to succeed in our metric. Then maybe we just moved our metric by 5%, something like that. And then divide that by the amount of engineering effort, and you get an overall kind of expected ROI of any given feature. And then you can stack rank those and do the ones that look the most valuable.”
What this model does is use some back-of-the-napkin math to project how an experiment is going to move the needle, so in essence, it makes Impact more quantifiable.
“It's really powerful in that it helps the entire team internalize the trade-off of achieving a given metrics win with how much effort goes into it. And what I found is when I do that on teams, they themselves come up with projects that have higher expected ROIs. They come up with ideas that impact the metric more and also do it with less effort such that their project kind of rides up that stack rank to the top.”
When do you a/b test, and when do you ship?
Before we conclude this post, we wanted to touch briefly on a/b testing. We’re not going to go into what tool to use to set these up, what to test, or how to determine success. Instead, we want to focus on a larger industry shift that’s happened in the past five years.
Tech and its thought leaders are moving away from micro-optimizations or small micro-conversions on websites. In this original growth-hacking model, teams might A/B test a headline, button copy, or on-page video performance.
It’s our belief that this methodology wasn’t born just from strategy (many micro-optimizations mean an overall large lift on a page) but from our technical capabilities. In the early 2010s, software was eating the world, and for the first time, we had readily accessible tools that let us test small micro-optimizations. A decade later, we know that you can get small lifts here and there, but in general, there’s more to be gained with a greater strategic effort.
Darius describes how they think of this at Otter.ai.
“Our Head of Data at Otter.ai says you shouldn't run an A/B test every time. For instance, if you have a product that you want to launch anyway, like you think it's just a better feature experience, or at some level you're required to launch it, then you should probably just launch it. And if you want to, you can just look at the numbers before and after. That'll give you some indication of how this feature launch has changed your numbers. Even though it's not a perfect indication, because obviously it's temporal and there's maybe other things that happened after that launch date, it'll give you some indication, and it also just saves you a bunch of time.”
Zooming out. That just makes sense to us. Why a/b test something you know you’re going to do? If you strongly believe a major change moves you to a new strategy faster, do it.
Darius makes a strong point that this is especially important for growing startups where traffic is still small at statistical significance and takes time to reach.
“If you have like 100 users sign up a day, you're just not going to have the volume in order to run a meaningful A/B test to statsig anytime soon. And so for the most part, you should just have good ideas and launch them and then maybe just look at the numbers,” he said.
Of course, if a change is extremely dramatic, you can hit statistical significance even with small numbers. But especially before you hit product-market fit it’s hard to tell what’s going to be dramatic and it may be just as fast to launch something, watch, and reverse if it fails.


