


Soda is the data reliability and quality platform that creates the observability data teams need to find, analyze, and resolve data issues. Our open-source tools and cloud platform bring everyone closer to the data, resulting in data products and analytics that everyone can trust.
Background
Soda was funded in 2018, raised their Seed round in 2020, and a Series A in 2021. Soda has a dual product approach to solving the number one data management challenge faced by modern organizations: ensuring high quality, trusted data is available:
- Soda Core - open-source data reliability engineering as-code to create coverage and eliminate data downtime
- Soda Cloud - the SaaS platform to maintain data quality and alleviate the fear of not knowing, and the pain of finding out too late, that a data quality issues has had a downstream impact
Soda’s goal is to build the most delightful open-source framework, and cloud platform for data quality and reliability.
Almost every company is building innovative new products using data, which means that data has to be reliable enough to meet a wide range of evolving needs.
The challenge: building a cloud data quality platform users love
Mathisse knew Soda could leverage usage data to make their first customers insanely happy with their product. This would then enable Soda to scale.
He didn’t want to spend months figuring out this topic, and wanted to give quick access to usage data to multiple disciplines at Soda.
Here is how he did it!
The solution
Find out what makes the product sticky
The priority for Mathisse was to make sure the team was building a sticky product. With a dual product approach of open-source and cloud, Soda needs to be able to effectively strategize its roadmap and prioritize engineering and development priorities and time. This means making tough prioritization decisions.
But Mathisse knows that none of that mattered if their users didn’t love their product.
So Mathisse seeked to find the set of (coherent) features that would make their customers stick. Mathisse started from account level retention. He used the cohort table to zoom into the list of sticky companies.
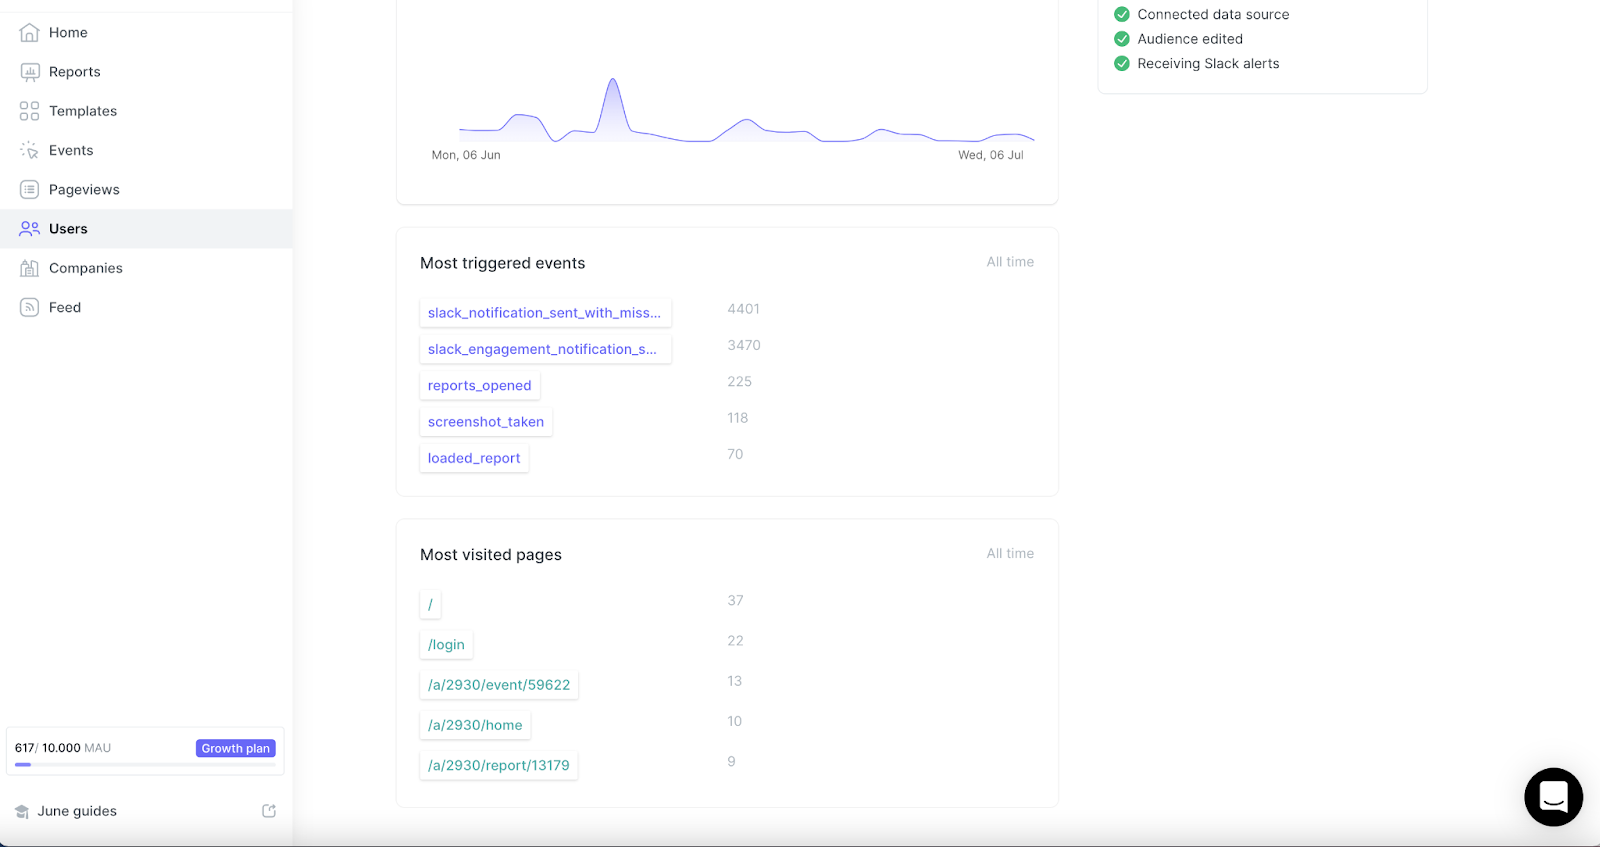
Then zoomed into these companies' active users. He opened users profiles, and looked for the use cases they activated on. The “most triggered events” and “most visited pages” sections gave him this answer.
Build a successful self-served onboarding
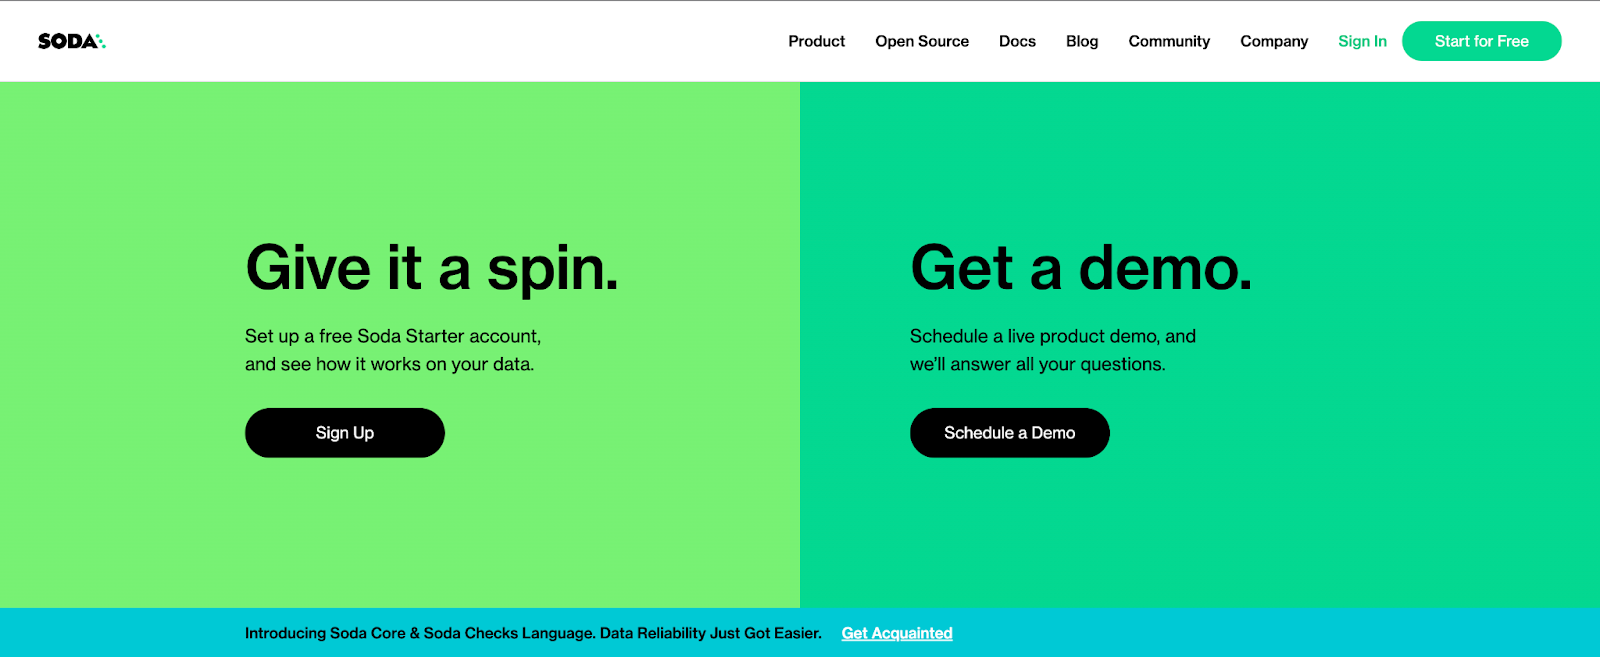
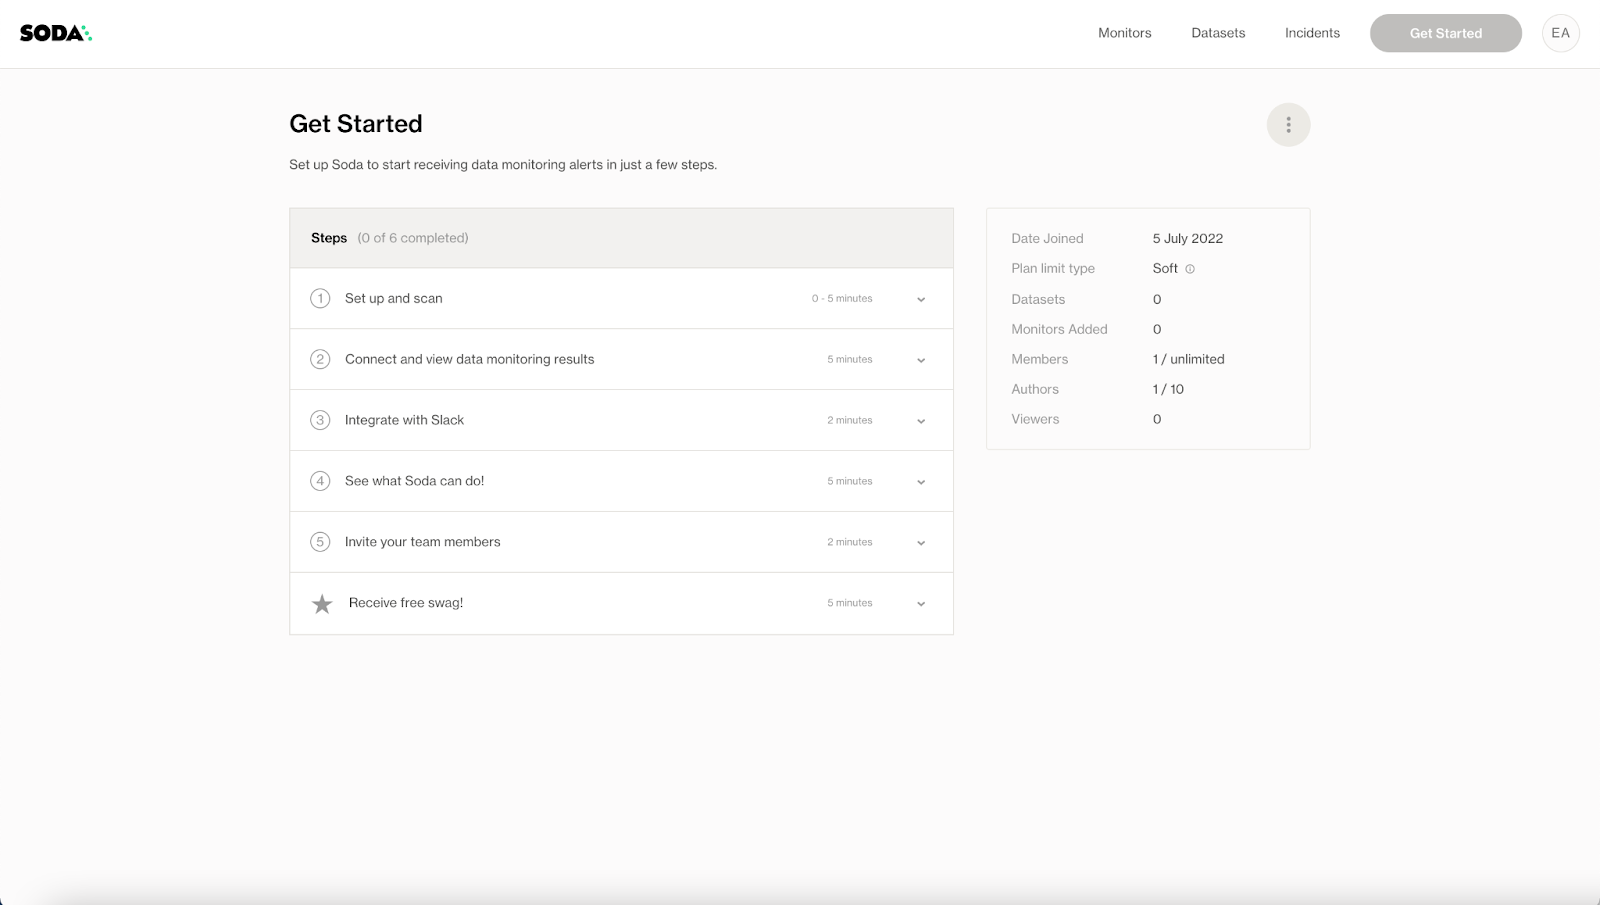
After Mathisse and his team were confident their product would stick, they worked on acquisition and launched a self-serve onboarding flow. Their idea was that users could easily get started with Soda and put to test the self-service and quick to value capabilities. .
For that they created a fork in their sign up flow (“Give it a spin”), it looked like this:
Mathisse measured the conversion rate in the sign up using a funnel.
He looked at where the biggest conversion rate drops happened and came up with hypotheses on why. He then exported users' emails and reached out to them to validate his hypotheses.

Releasing successful features
After the initial set of product features were released, Mathisse and his team looked into solving more problems for their customers, aka building more features.
Mathisse knew that by adding more features Soda could become a “feature factory” and wanted to avoid that. Instead the team wanted to make sure each single release was successful, or removed.
When his team released their incident management feature, they added a track event called “incident_create” then used a feature release analysis which gave the engagement and adoption of this feature.
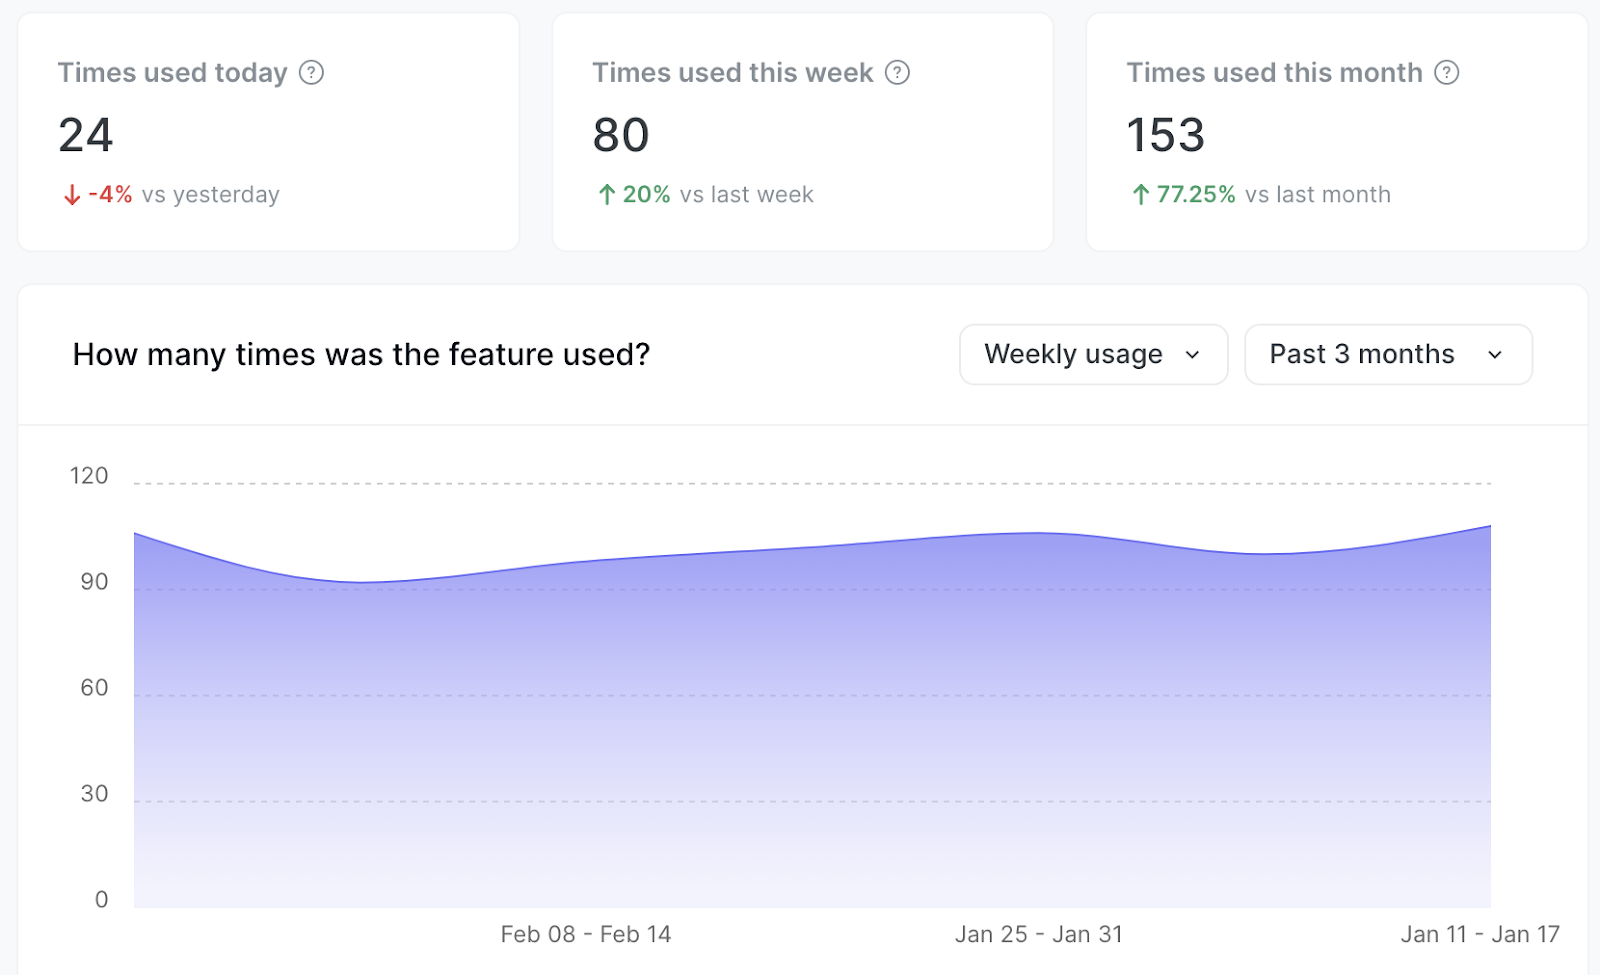
Based on their adoption target, the team was able to iterate on a feature or not.
Monitor top accounts engagement
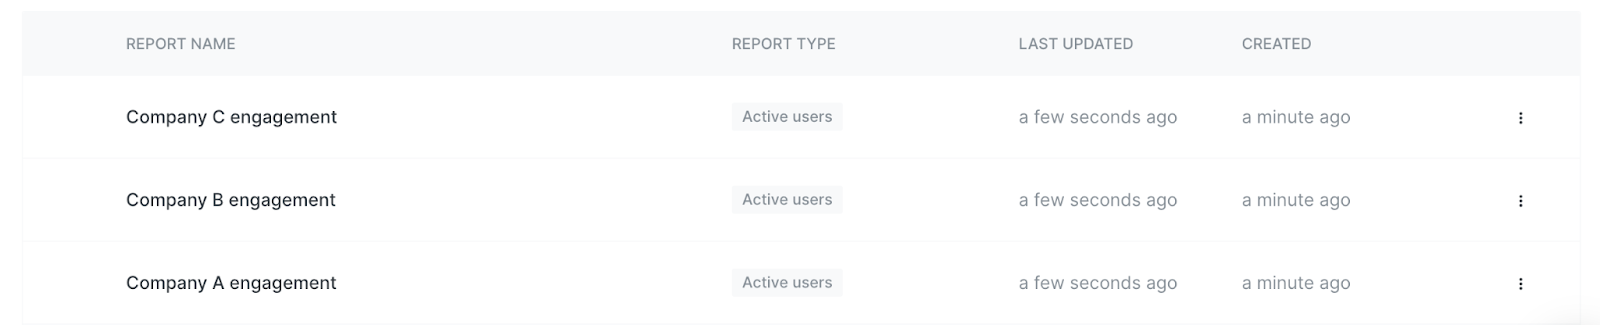
The Sales team uses June too, but to measure the number of active users within a strategic account. For that the team sets up one Active users report per key account.
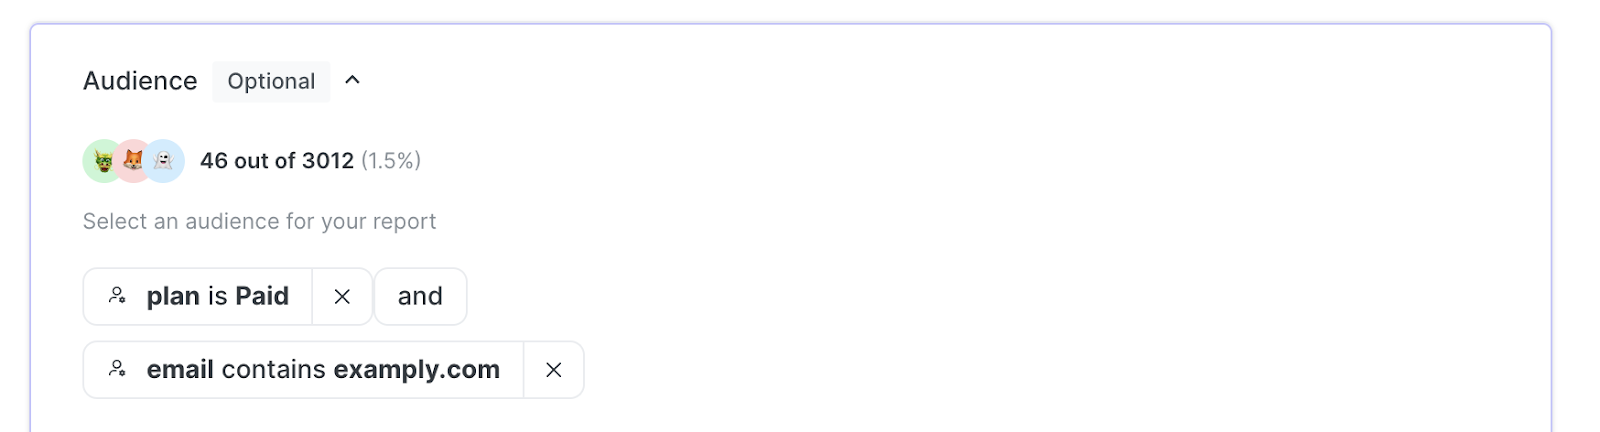
They do that by adding an audience filter on emails:
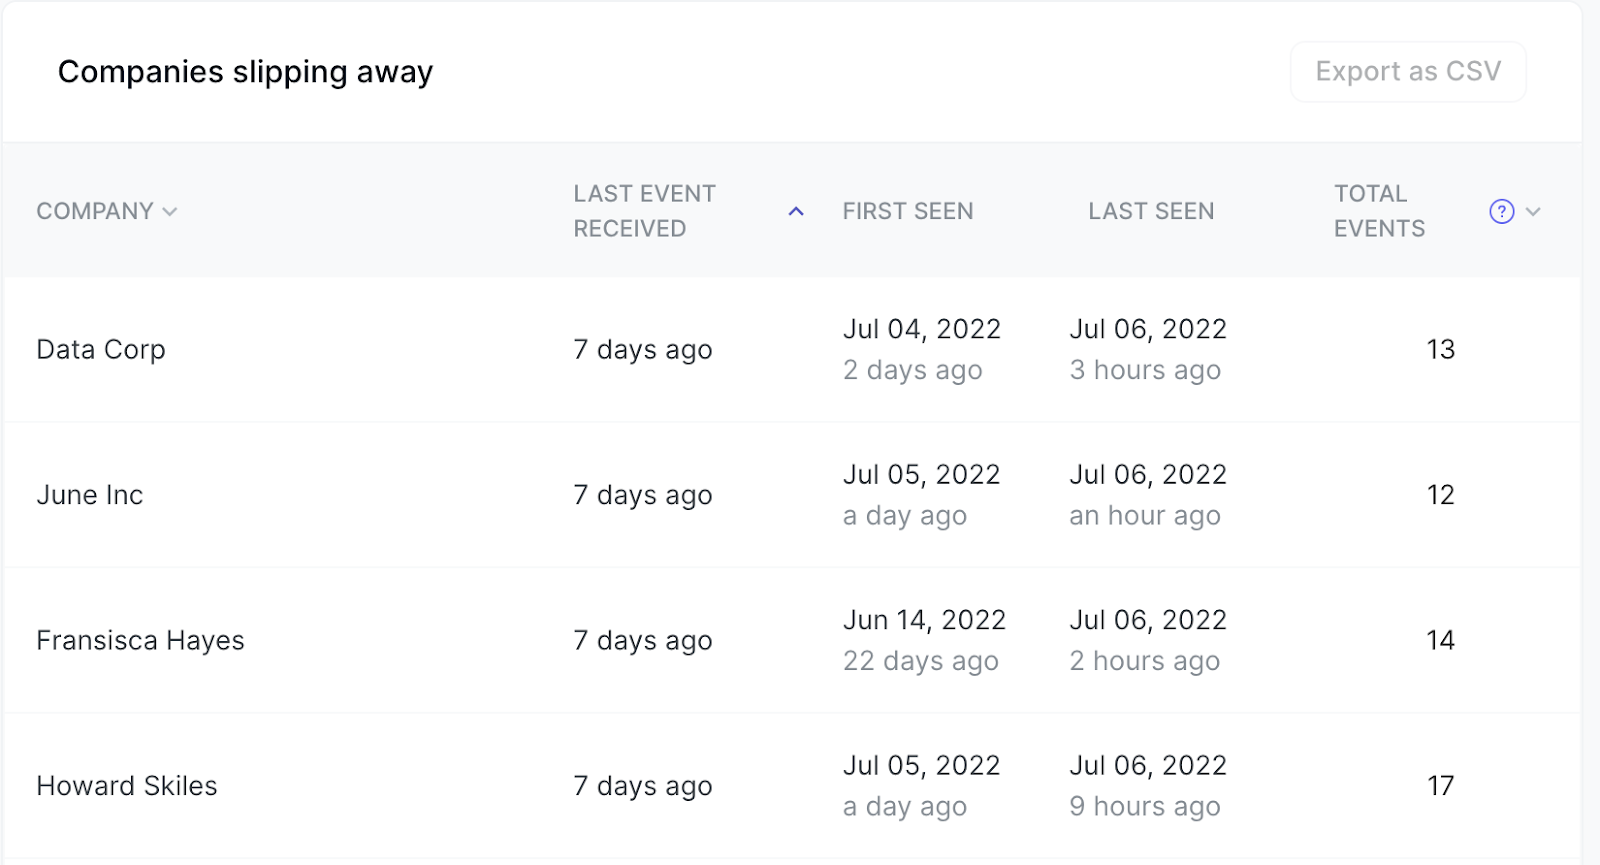
The sales team then regularly checks if the number of active users increases or remains steady. They will also be informed when accounts are slipping away.
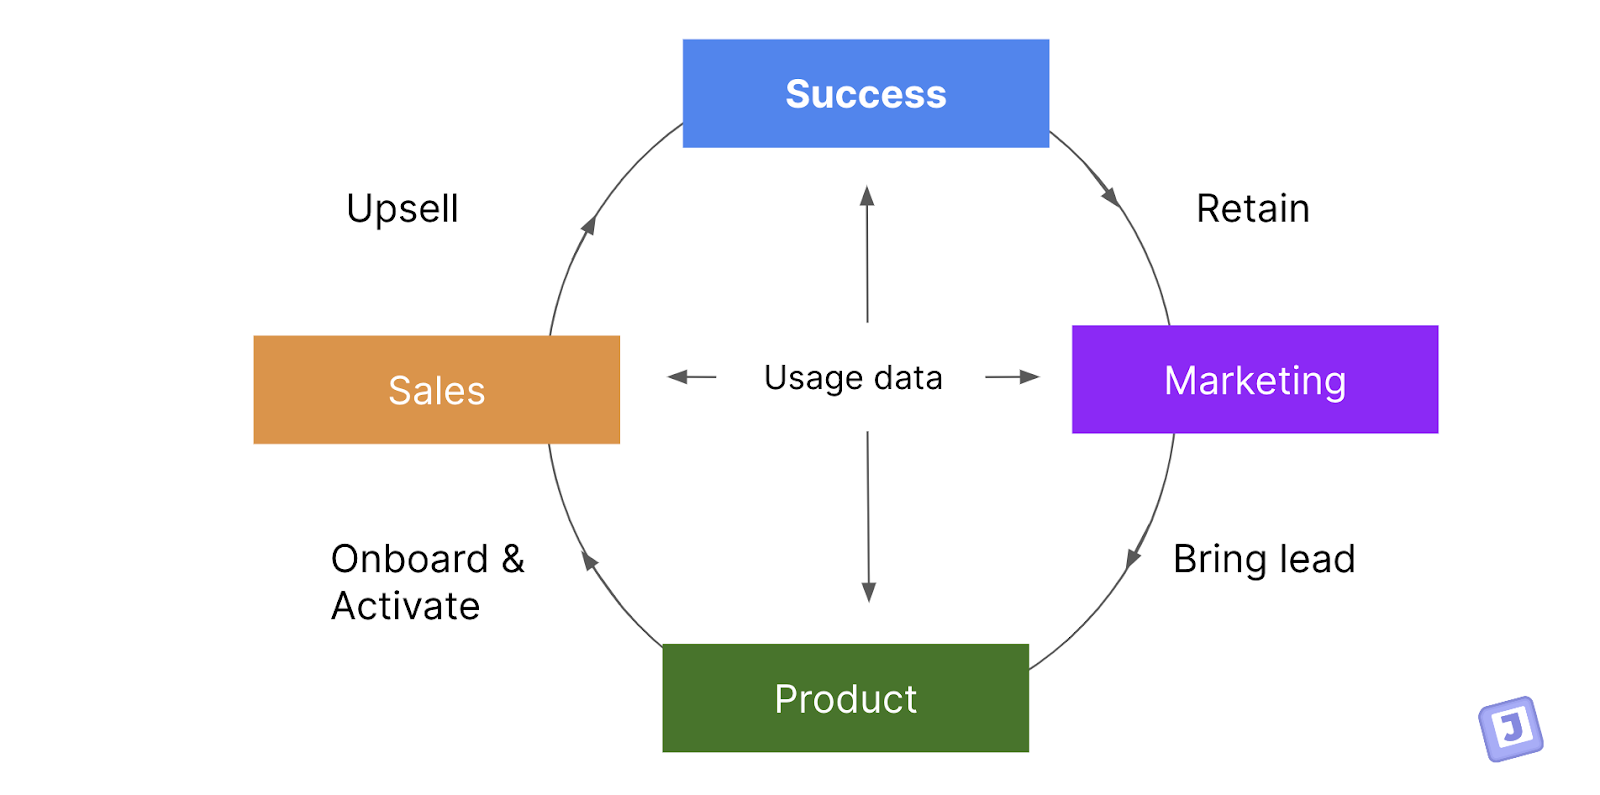
This way Mathisse makes usage data accessible to all inside his product organization, and the go-to-market / growth teams.
Make sure the business improves overall
Mathisse keeps a high level picture on Soda product usage. For that he uses Milestones.
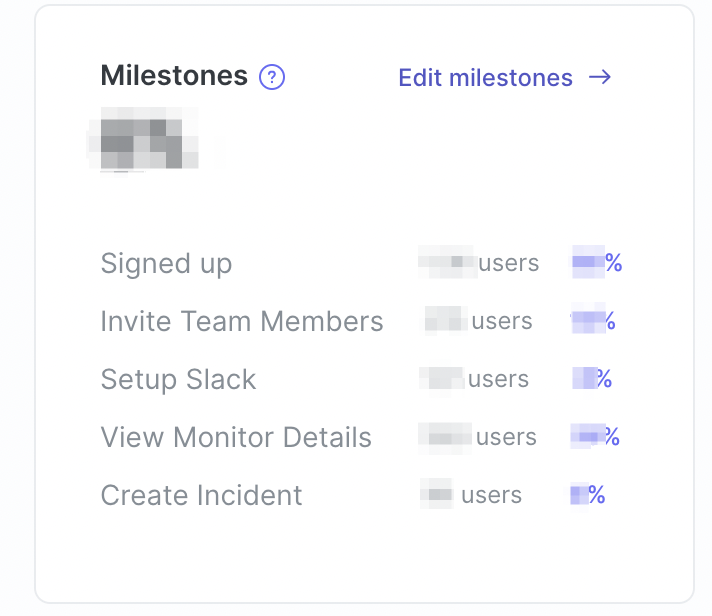
Milestones allowed him to understand if users crossed specific checkpoints in your product. Unlike funnels, milestones don’t have a strict order and help him optimize the broader journey, together with other teams involved.
“ Funnels are strict orders and used to optimize our workflows, Milestones instead helped us keep a high level picture of our product health.”
Mathisse - Product Lead @ Soda
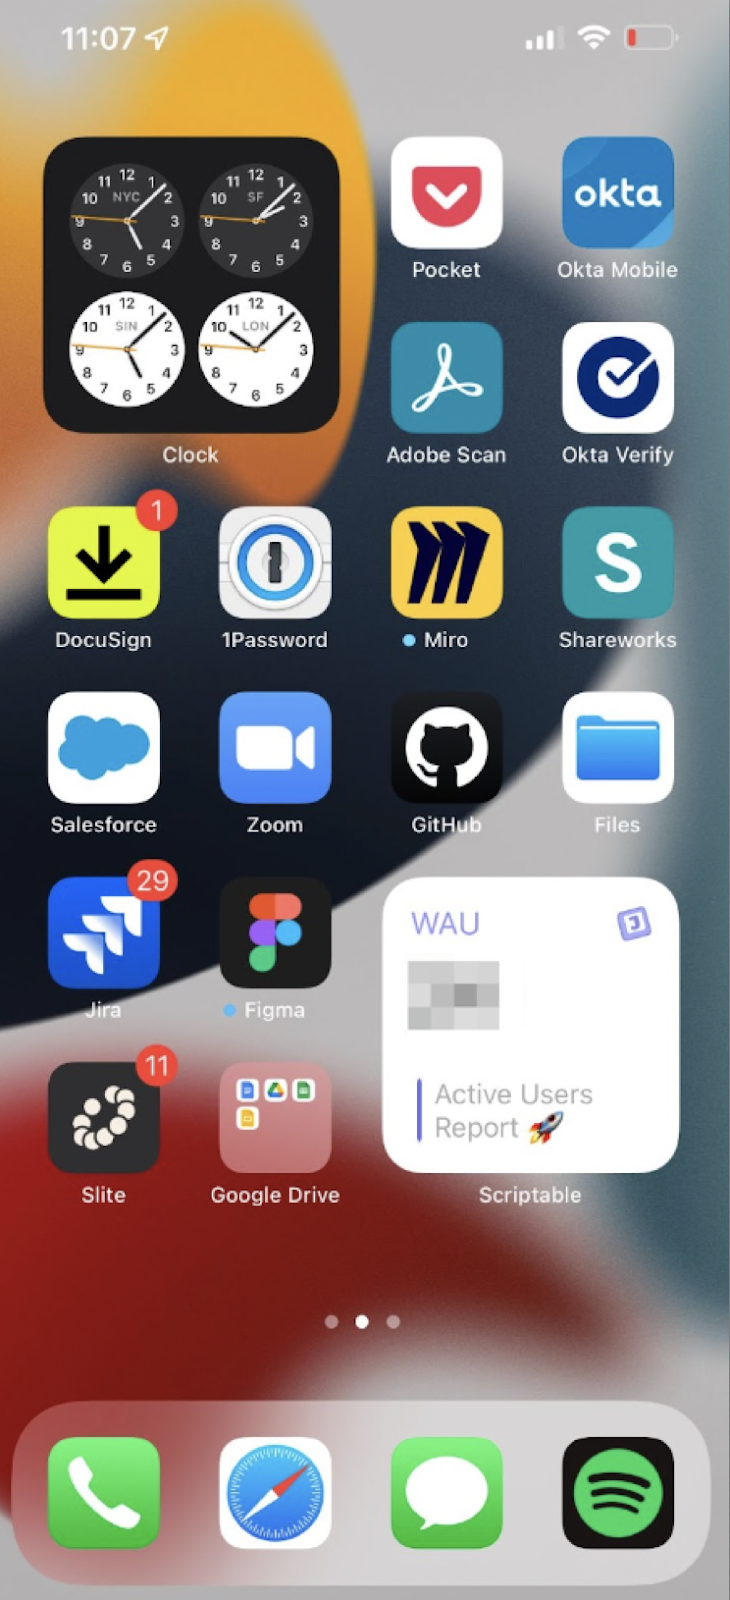
Mathisse also uses the June widget to get a quick pulse right on his phone of his leading metrics: the Weekly Active Users (WAU).
The outcome
Within 9 months Soda gave access to the usage data to everyone relevant in their product organization: product, engineering, go-to-market (growth, sales, marketing). This helped them make sure that each single customer is as successful as possible.
The Slack integration helped them rally behind this shared goal. Using an #internal-analytics channel, the marketing team was able to identify and nurture leads based on their stage, sales were able to catch slipping away and highly advanced usage.
The product team was able to understand user behavior and needs, and engage with customers to then determine what would provide the greatest value. The team incorporated that into the product roadmap.
Fast forward June helped the team to assess the impact of their work: uptake, adoption, and love for new features and capabilities. and the impact that has on evolving / shaping the product roadmap.


